

7 products
Dashboard, ledger, freight calculator, GLEC report, marketplace, purchase flow, event wizard.
Climate reporting is a regulator problem now. The banks that get there first ship infrastructure, not slide decks.
Fils is a climate-tech / fintech enterprise SaaS that helps banks and large companies count, offset, and report on their carbon emissions. The backend was powerful. The surface was dated. They tried us with a one-week free trial on the dashboard and offset flow, impact widget, greening-Earth animation, interactive offset slider. The trial converted into the full seven-product platform, live with an anchor bank by week twelve.
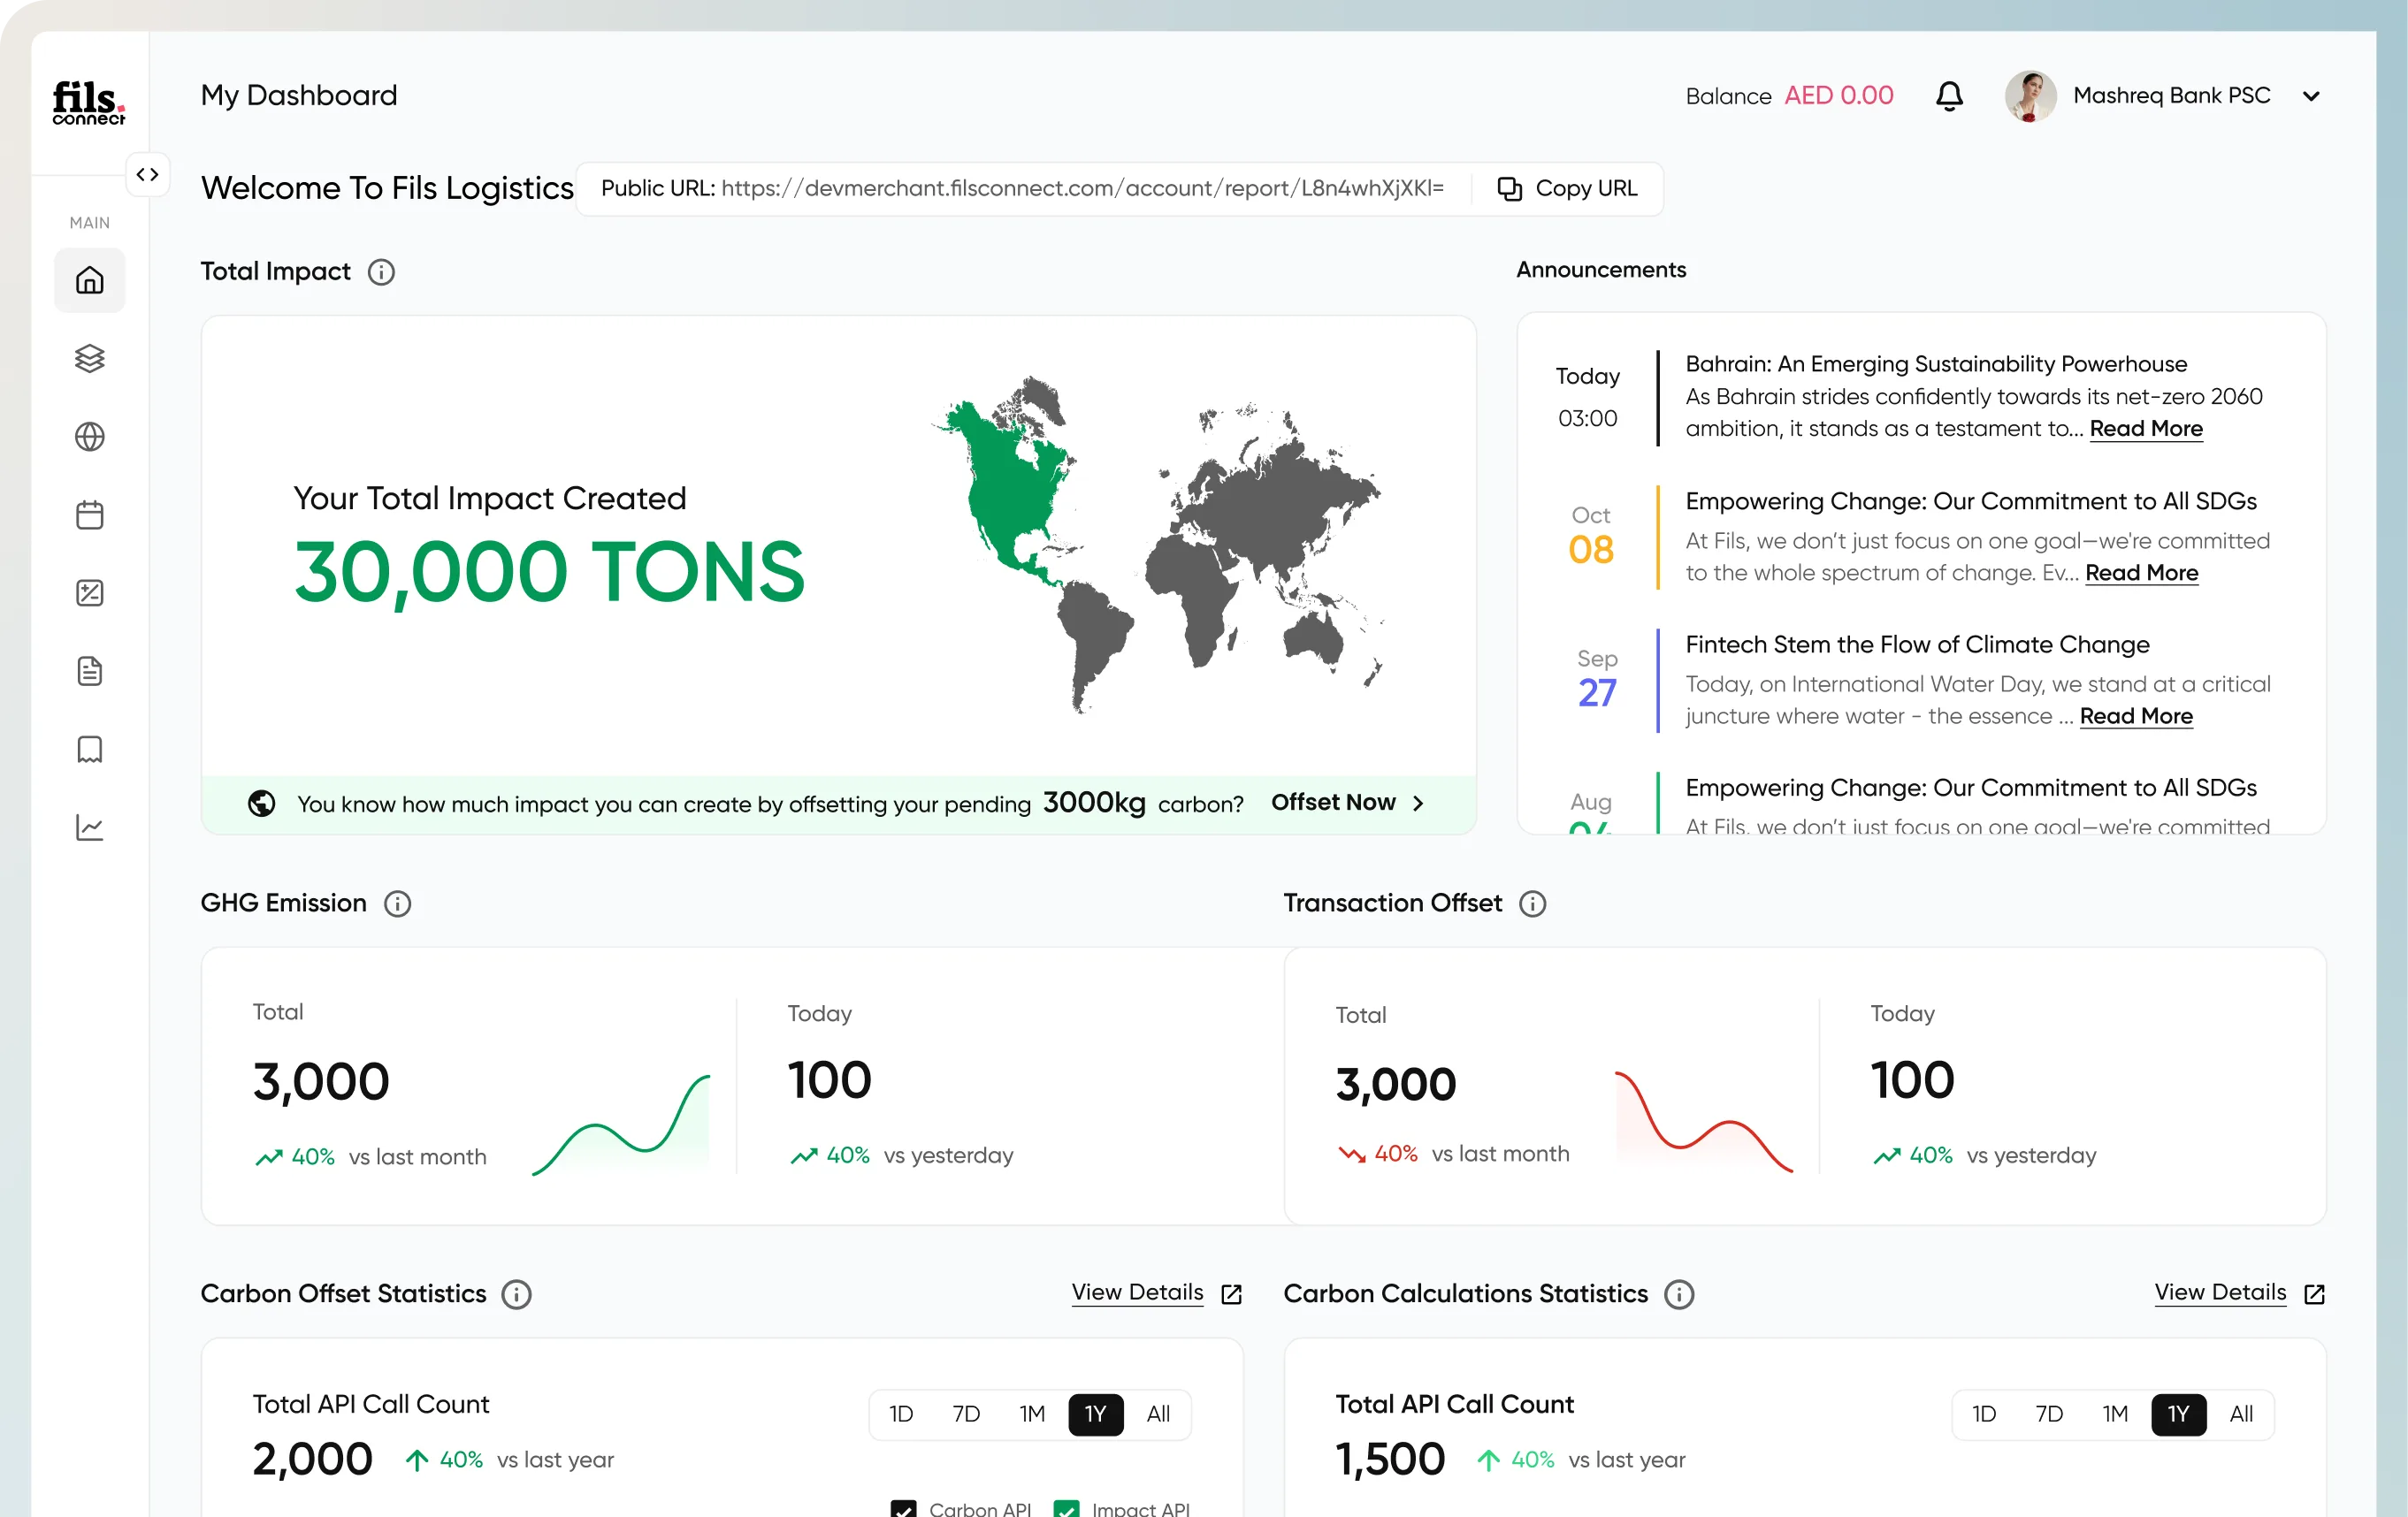
Seven products, one platform. Dashboard, emissions ledger, freight calculator, GLEC report, project marketplace, offset purchase flow, and an 8-step event carbon wizard, all under one shell, not seven Figma files.
Multi-tenant from the first wireframe. An anchor bank was named at kickoff, tenant primitives (theme tokens, navigation, access) had to live in the system from screen one, not be retrofitted later.
Bank-deployable by week twelve. Auditor-ready GLEC + GHG Protocol outputs as defaults (not toggles), shareable via public URL (not PDF), tenant-themed per bank. Procurement forwards links, not files.
Fils came in with a one-week free trial brief on three surfaces: the dashboard, the impact widget, and the offset slider. The Fils team converted the trial into the full multi-product engagement on the strength of those three. Then we ran the seven-product platform to anchor-bank in twelve weeks.
Shipping order mattered. We built IA and shared tokens (multi-tenant primitives, navigation, theme tokens, GHG-scope semantics) before any product screen, so the architecture would support additional bank tenants without per-tenant redesign. Then we rolled out the seven surfaces in parallel: dashboard, ledger, freight calculator, GLEC report, marketplace, purchase flow, and an 8-step event wizard. GLEC + GHG Protocol as default outputs, not toggles. Live in production by week twelve.
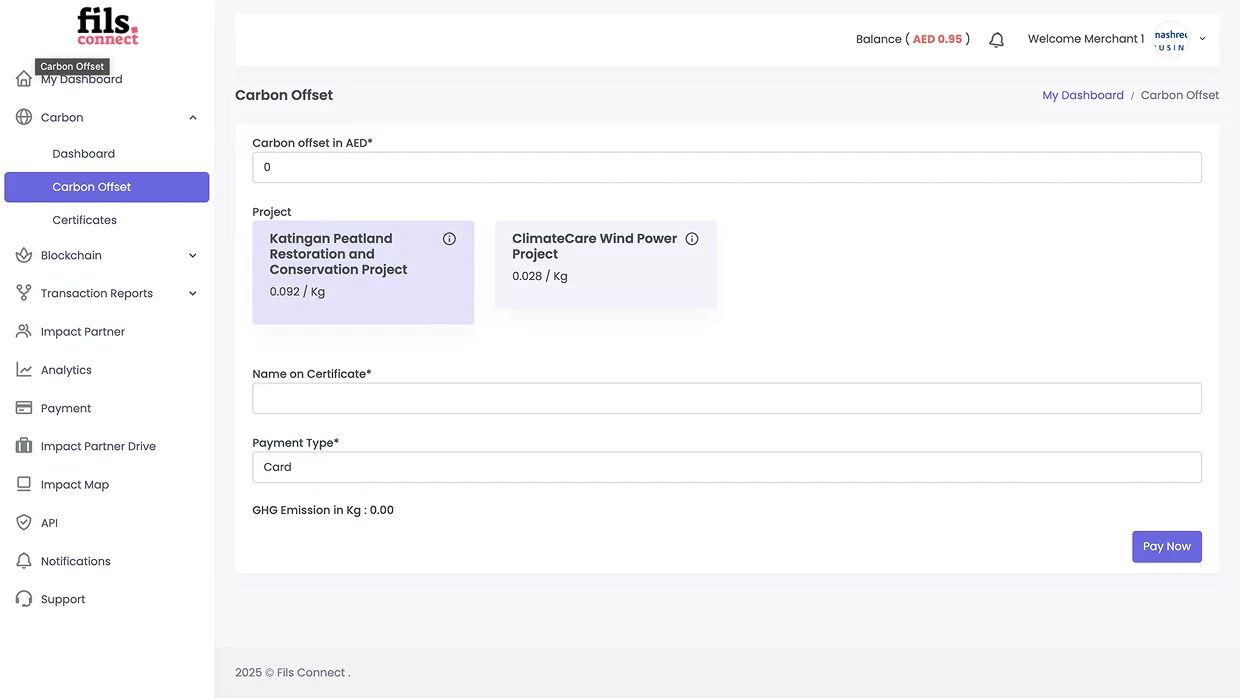
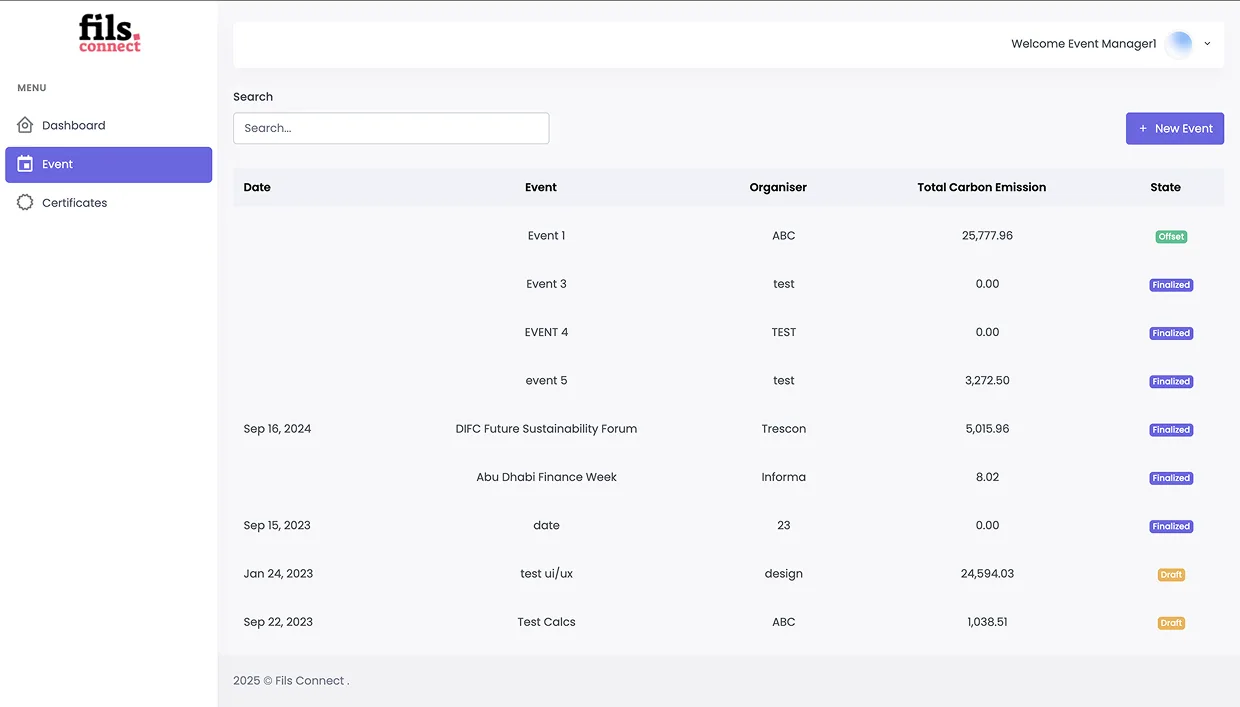
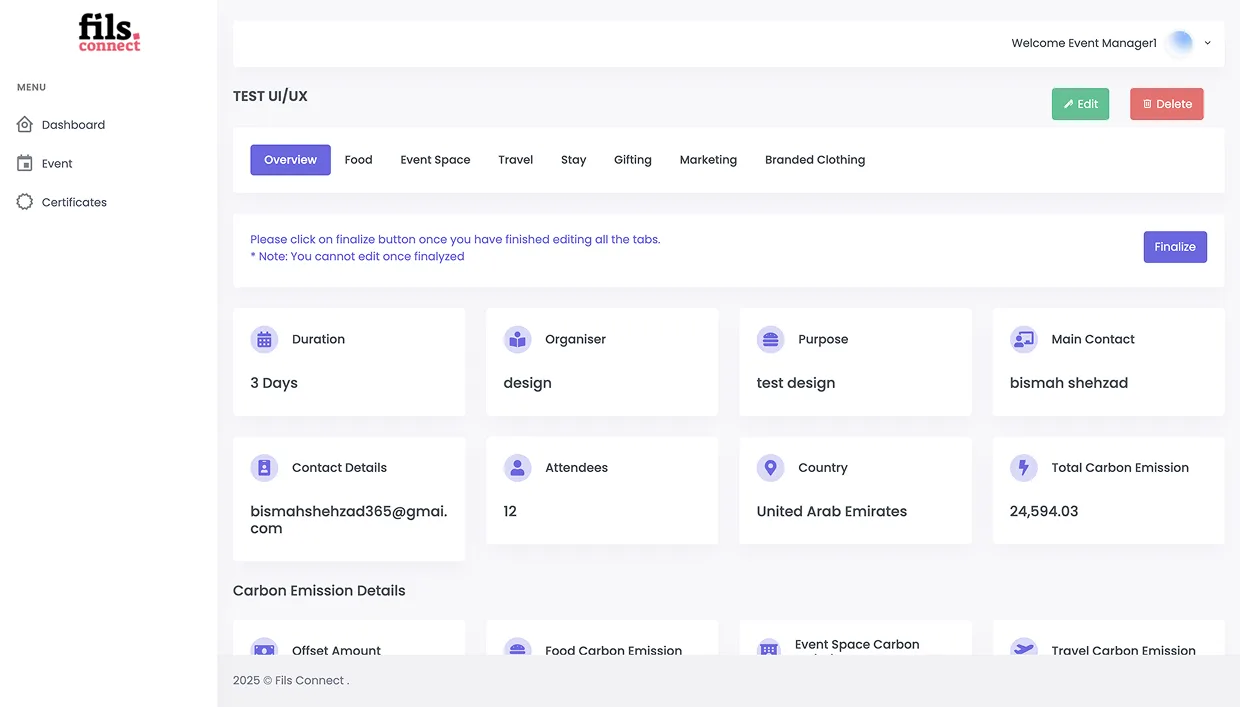
Fils had product-market fit on the climate-tech narrative, the product worked. But the surface had been built by different hands at different times: single-tenant where it needed to be multi-tenant, tab-based where it needed to be a wizard, two-project where it needed to be a marketplace. This is what the platform looked like when the twelve weeks began.
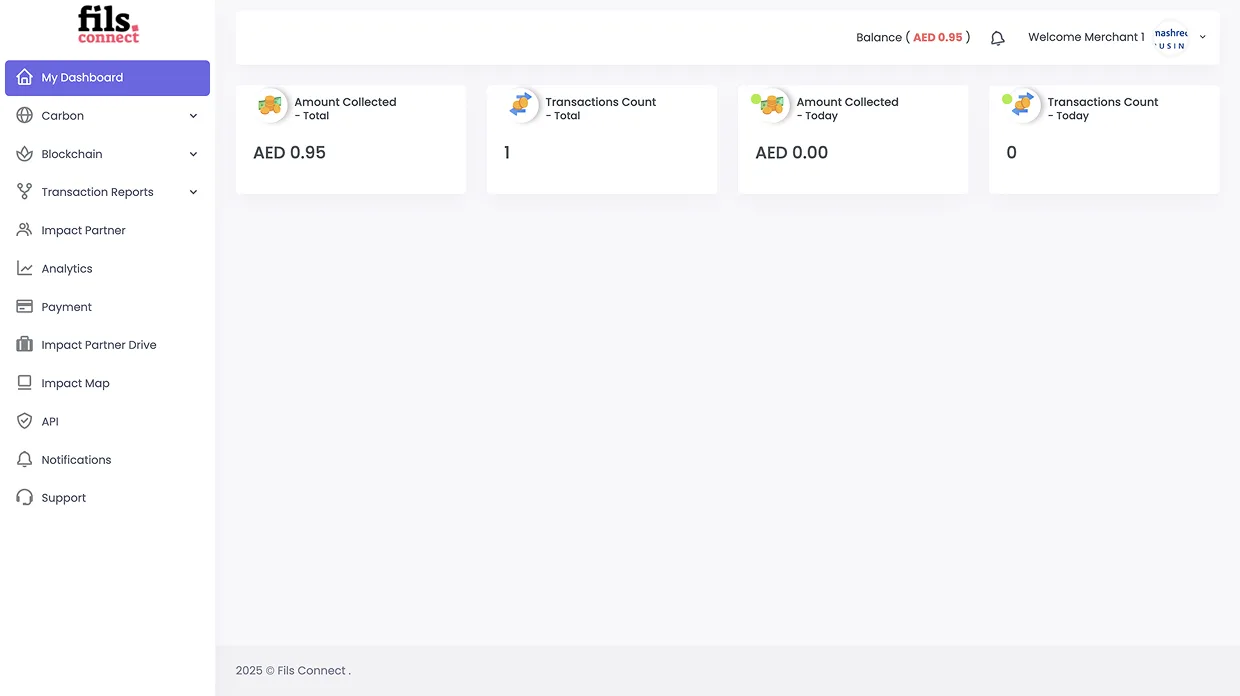
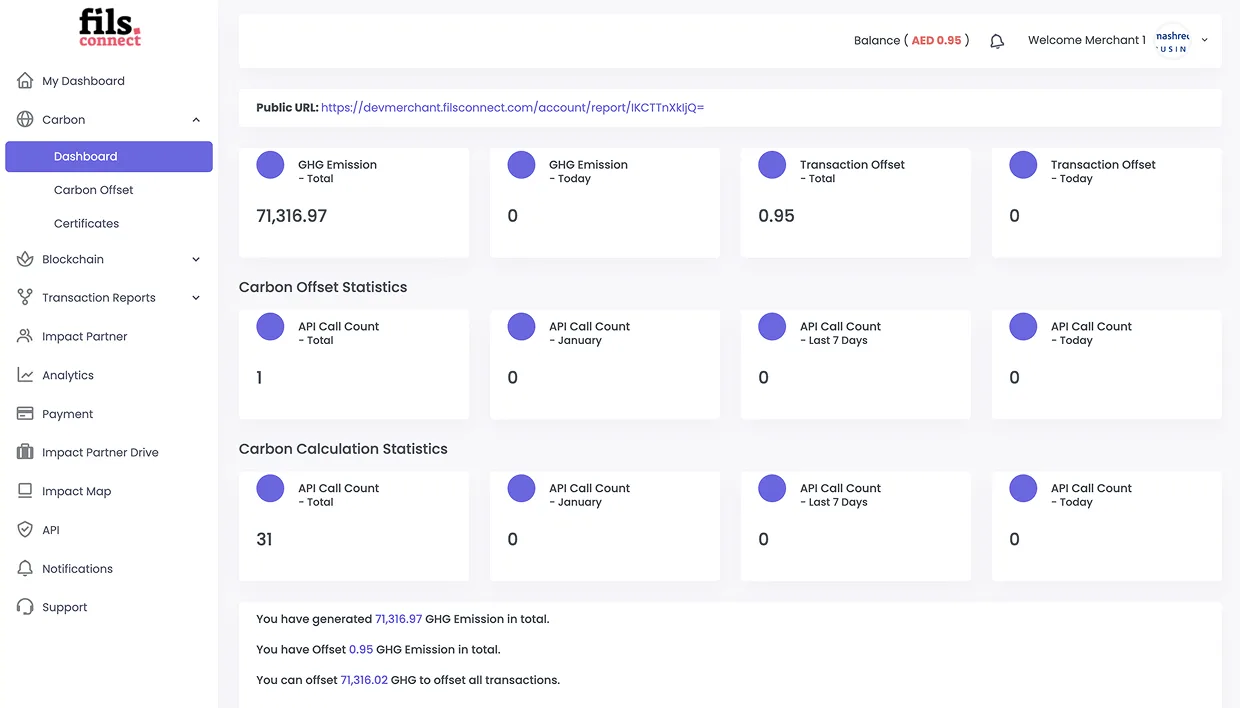
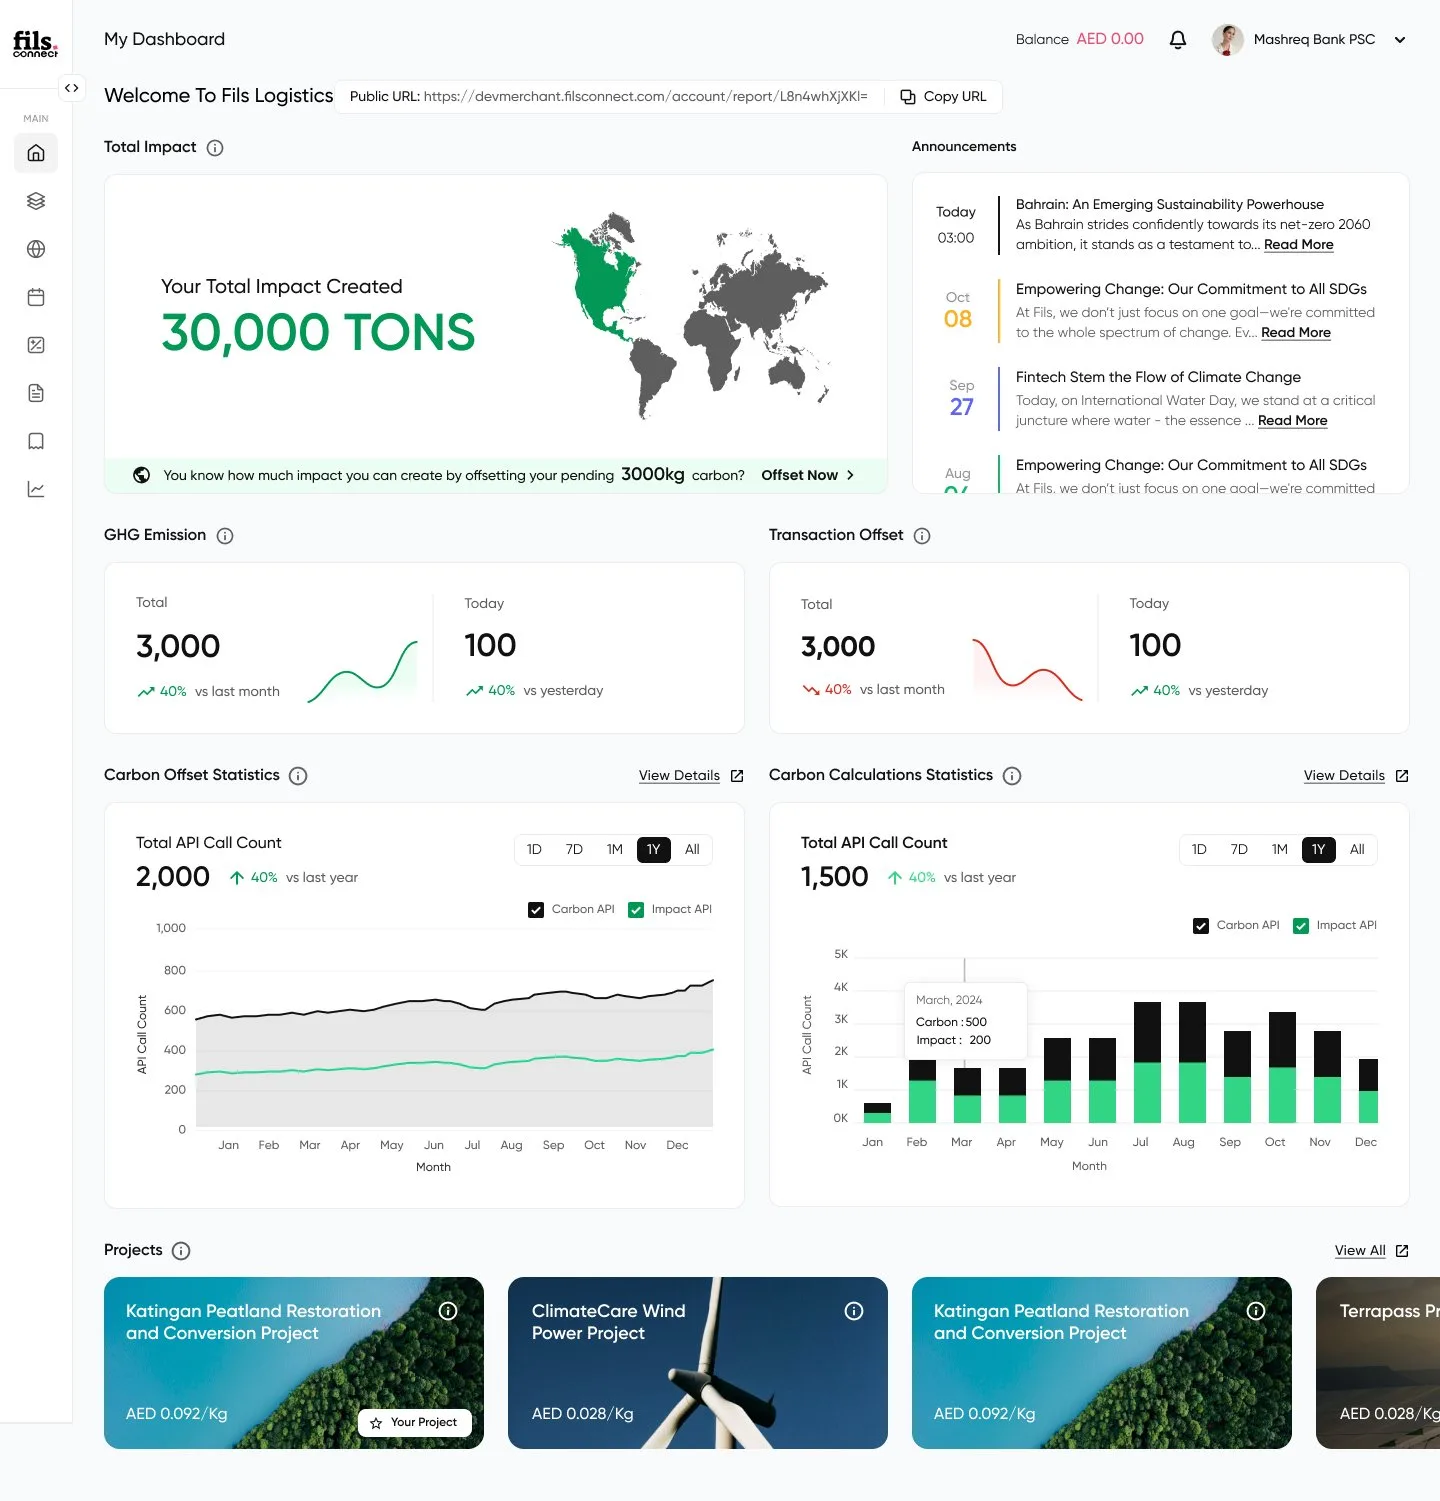
The Fils dashboard is the surface every other product reports back into, total impact in tonnes, scope-1/2/3 GHG, transaction offset rate, and the project marketplace strip. Underneath sit the seven products (ledger, calculator, GLEC report, marketplace, purchase flow, event wizard, transactions), all designed against one shared system: nav, sidebar, theme, components, status colors pulling from the same library.
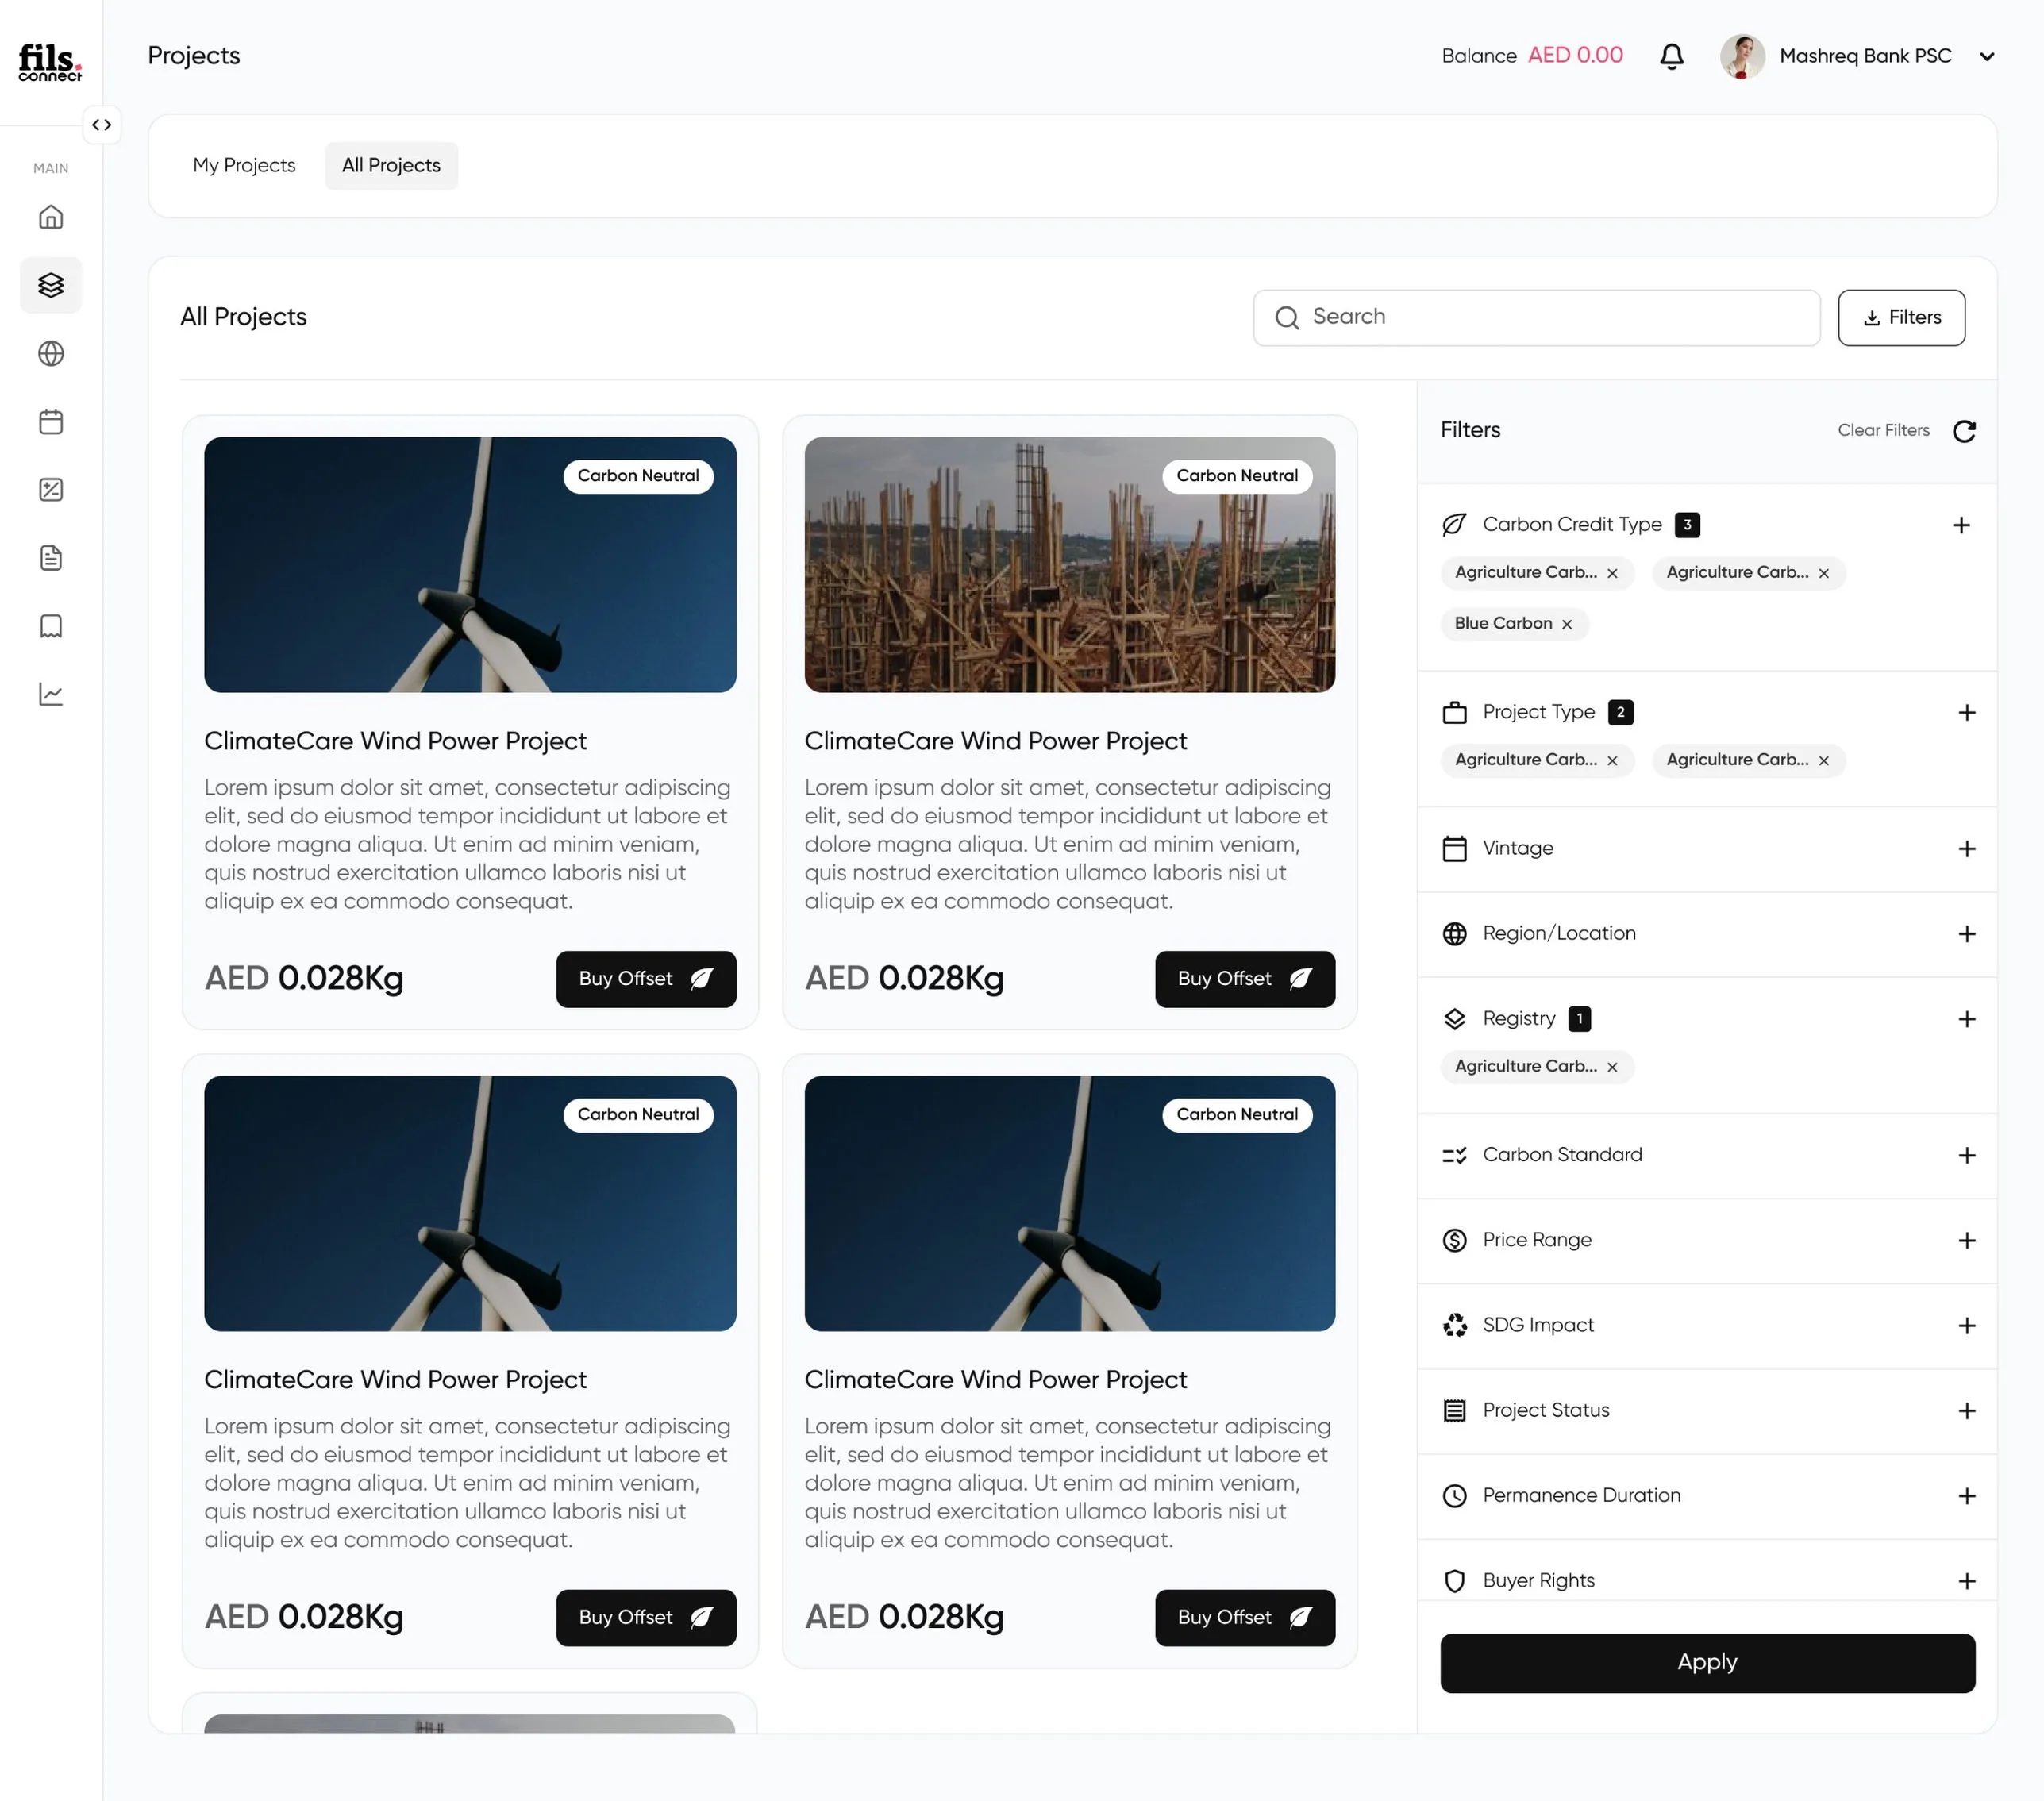
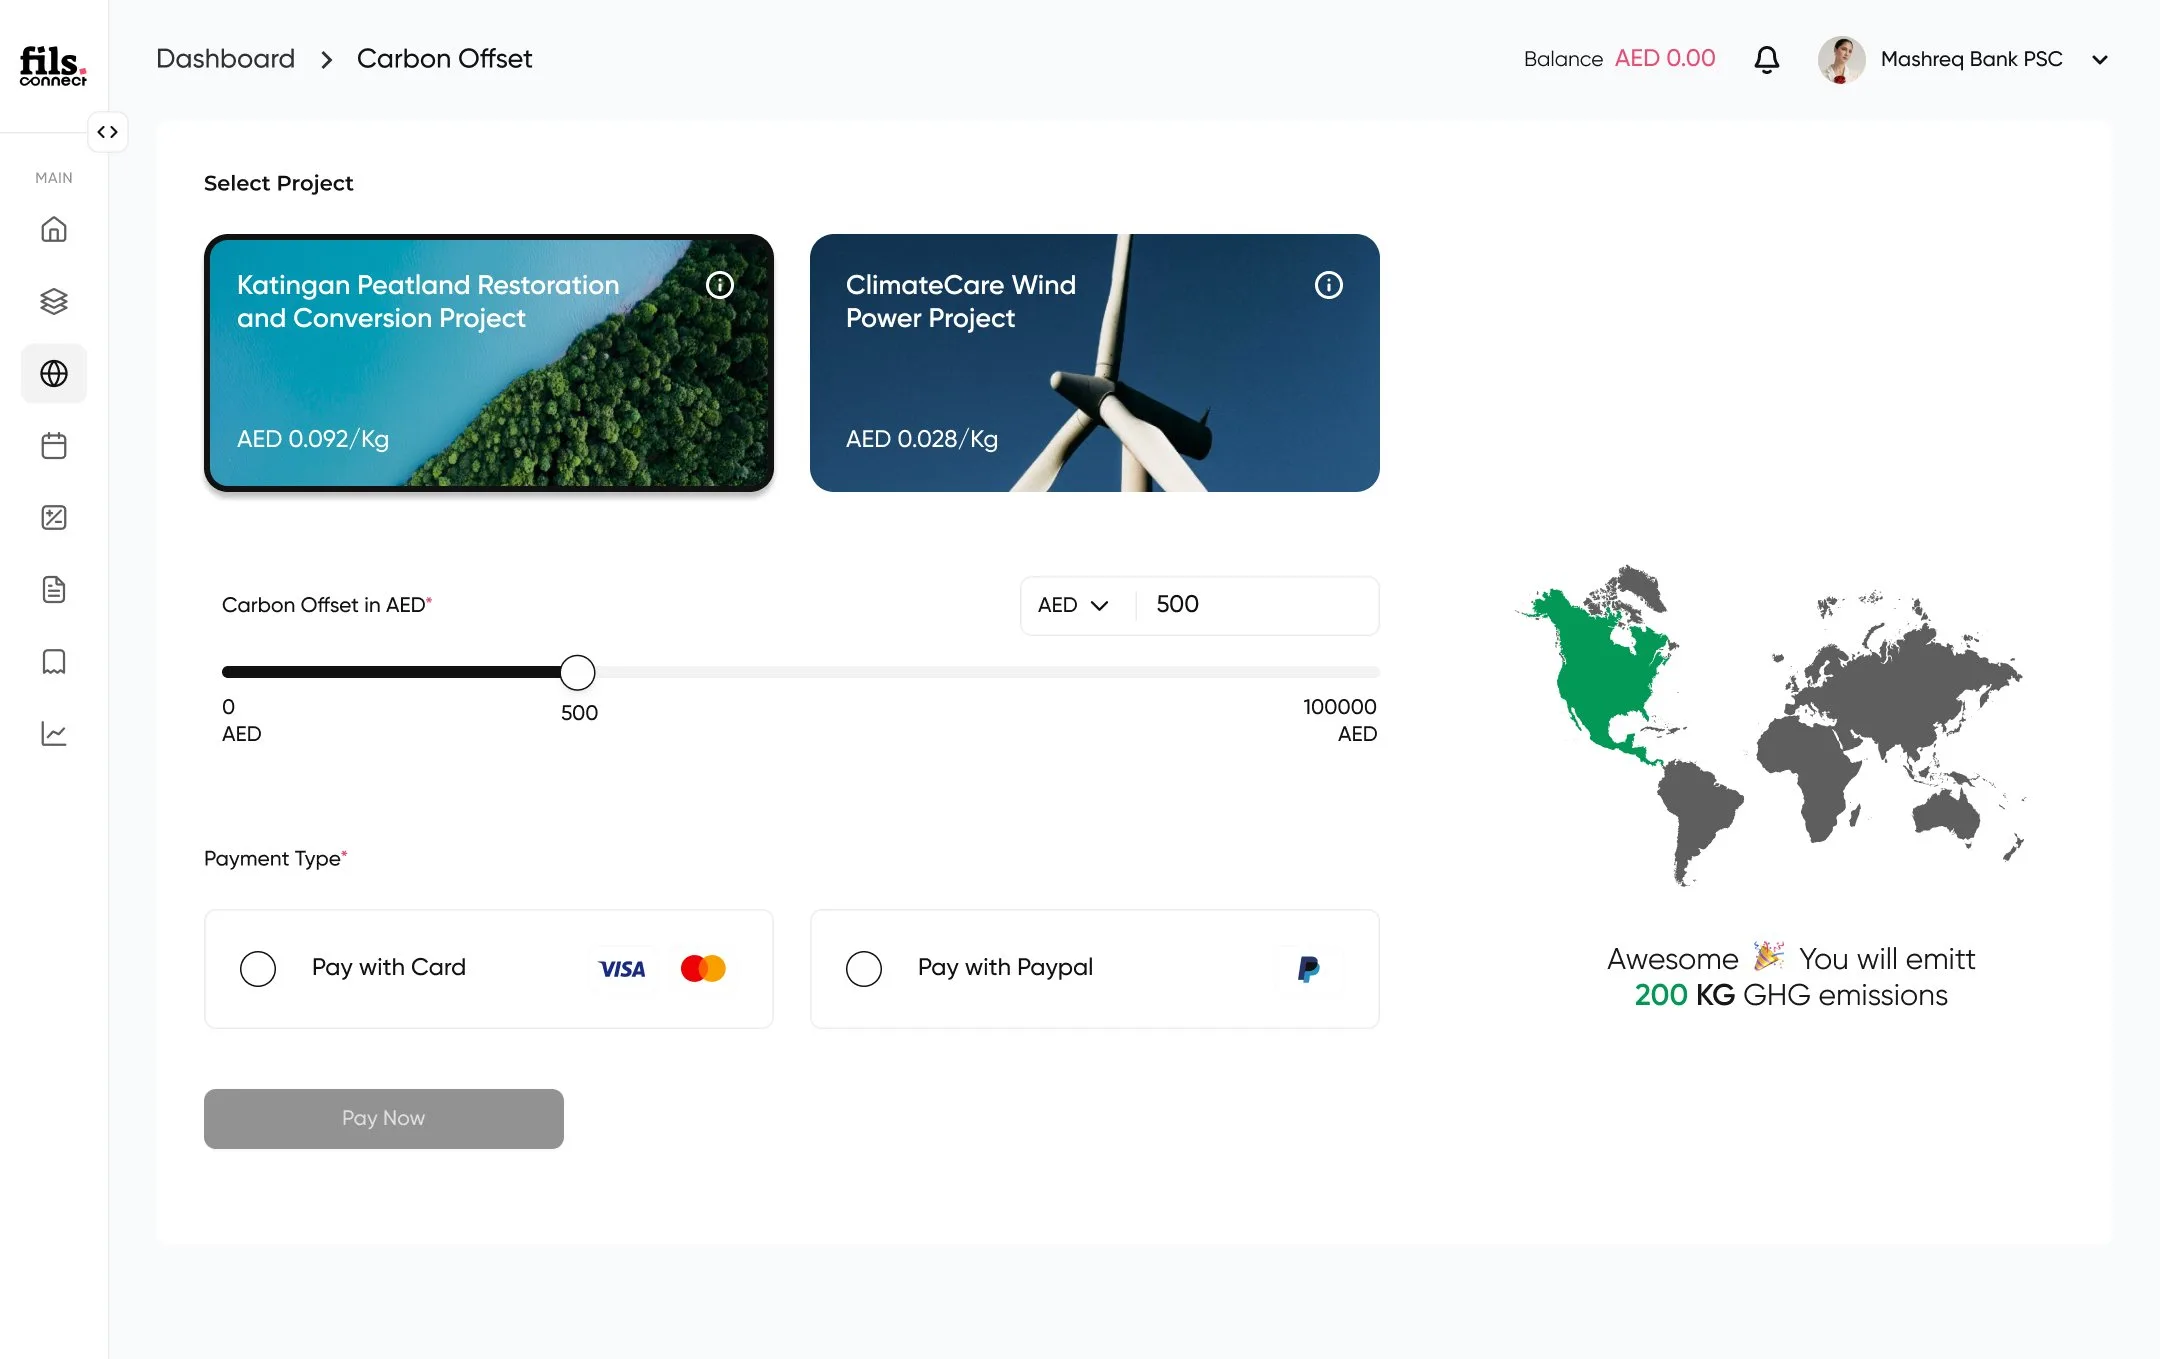
A buyer-side experience for picking verified carbon projects, sized to match a tenant’s footprint. The catalog runs the full filter spec (credit type, vintage, registry, standard, SDG impact, etc.) with active filters as removable chips. The purchase flow is its own product: pick a project, dial the offset via slider or direct input, see the impact map render live, pay. Every purchase writes to the transactions ledger.
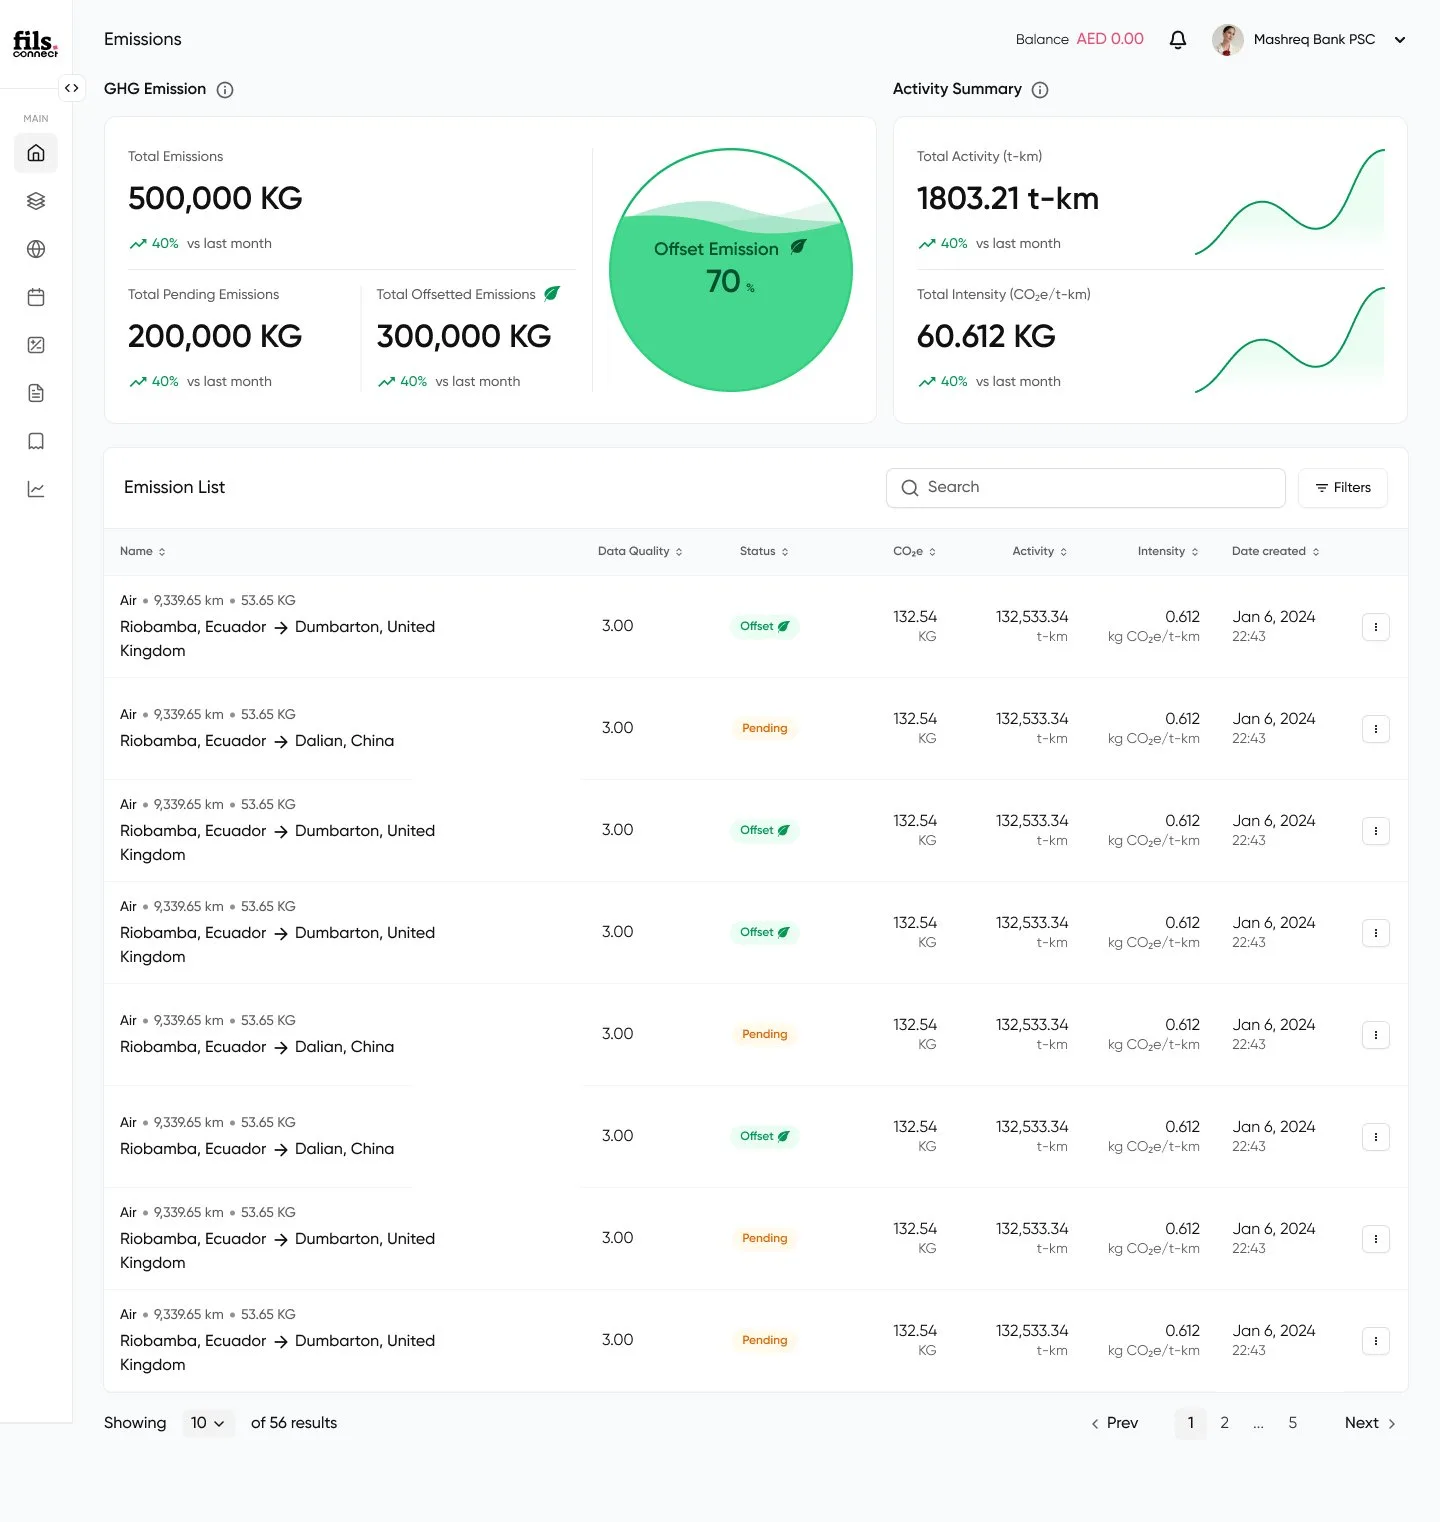
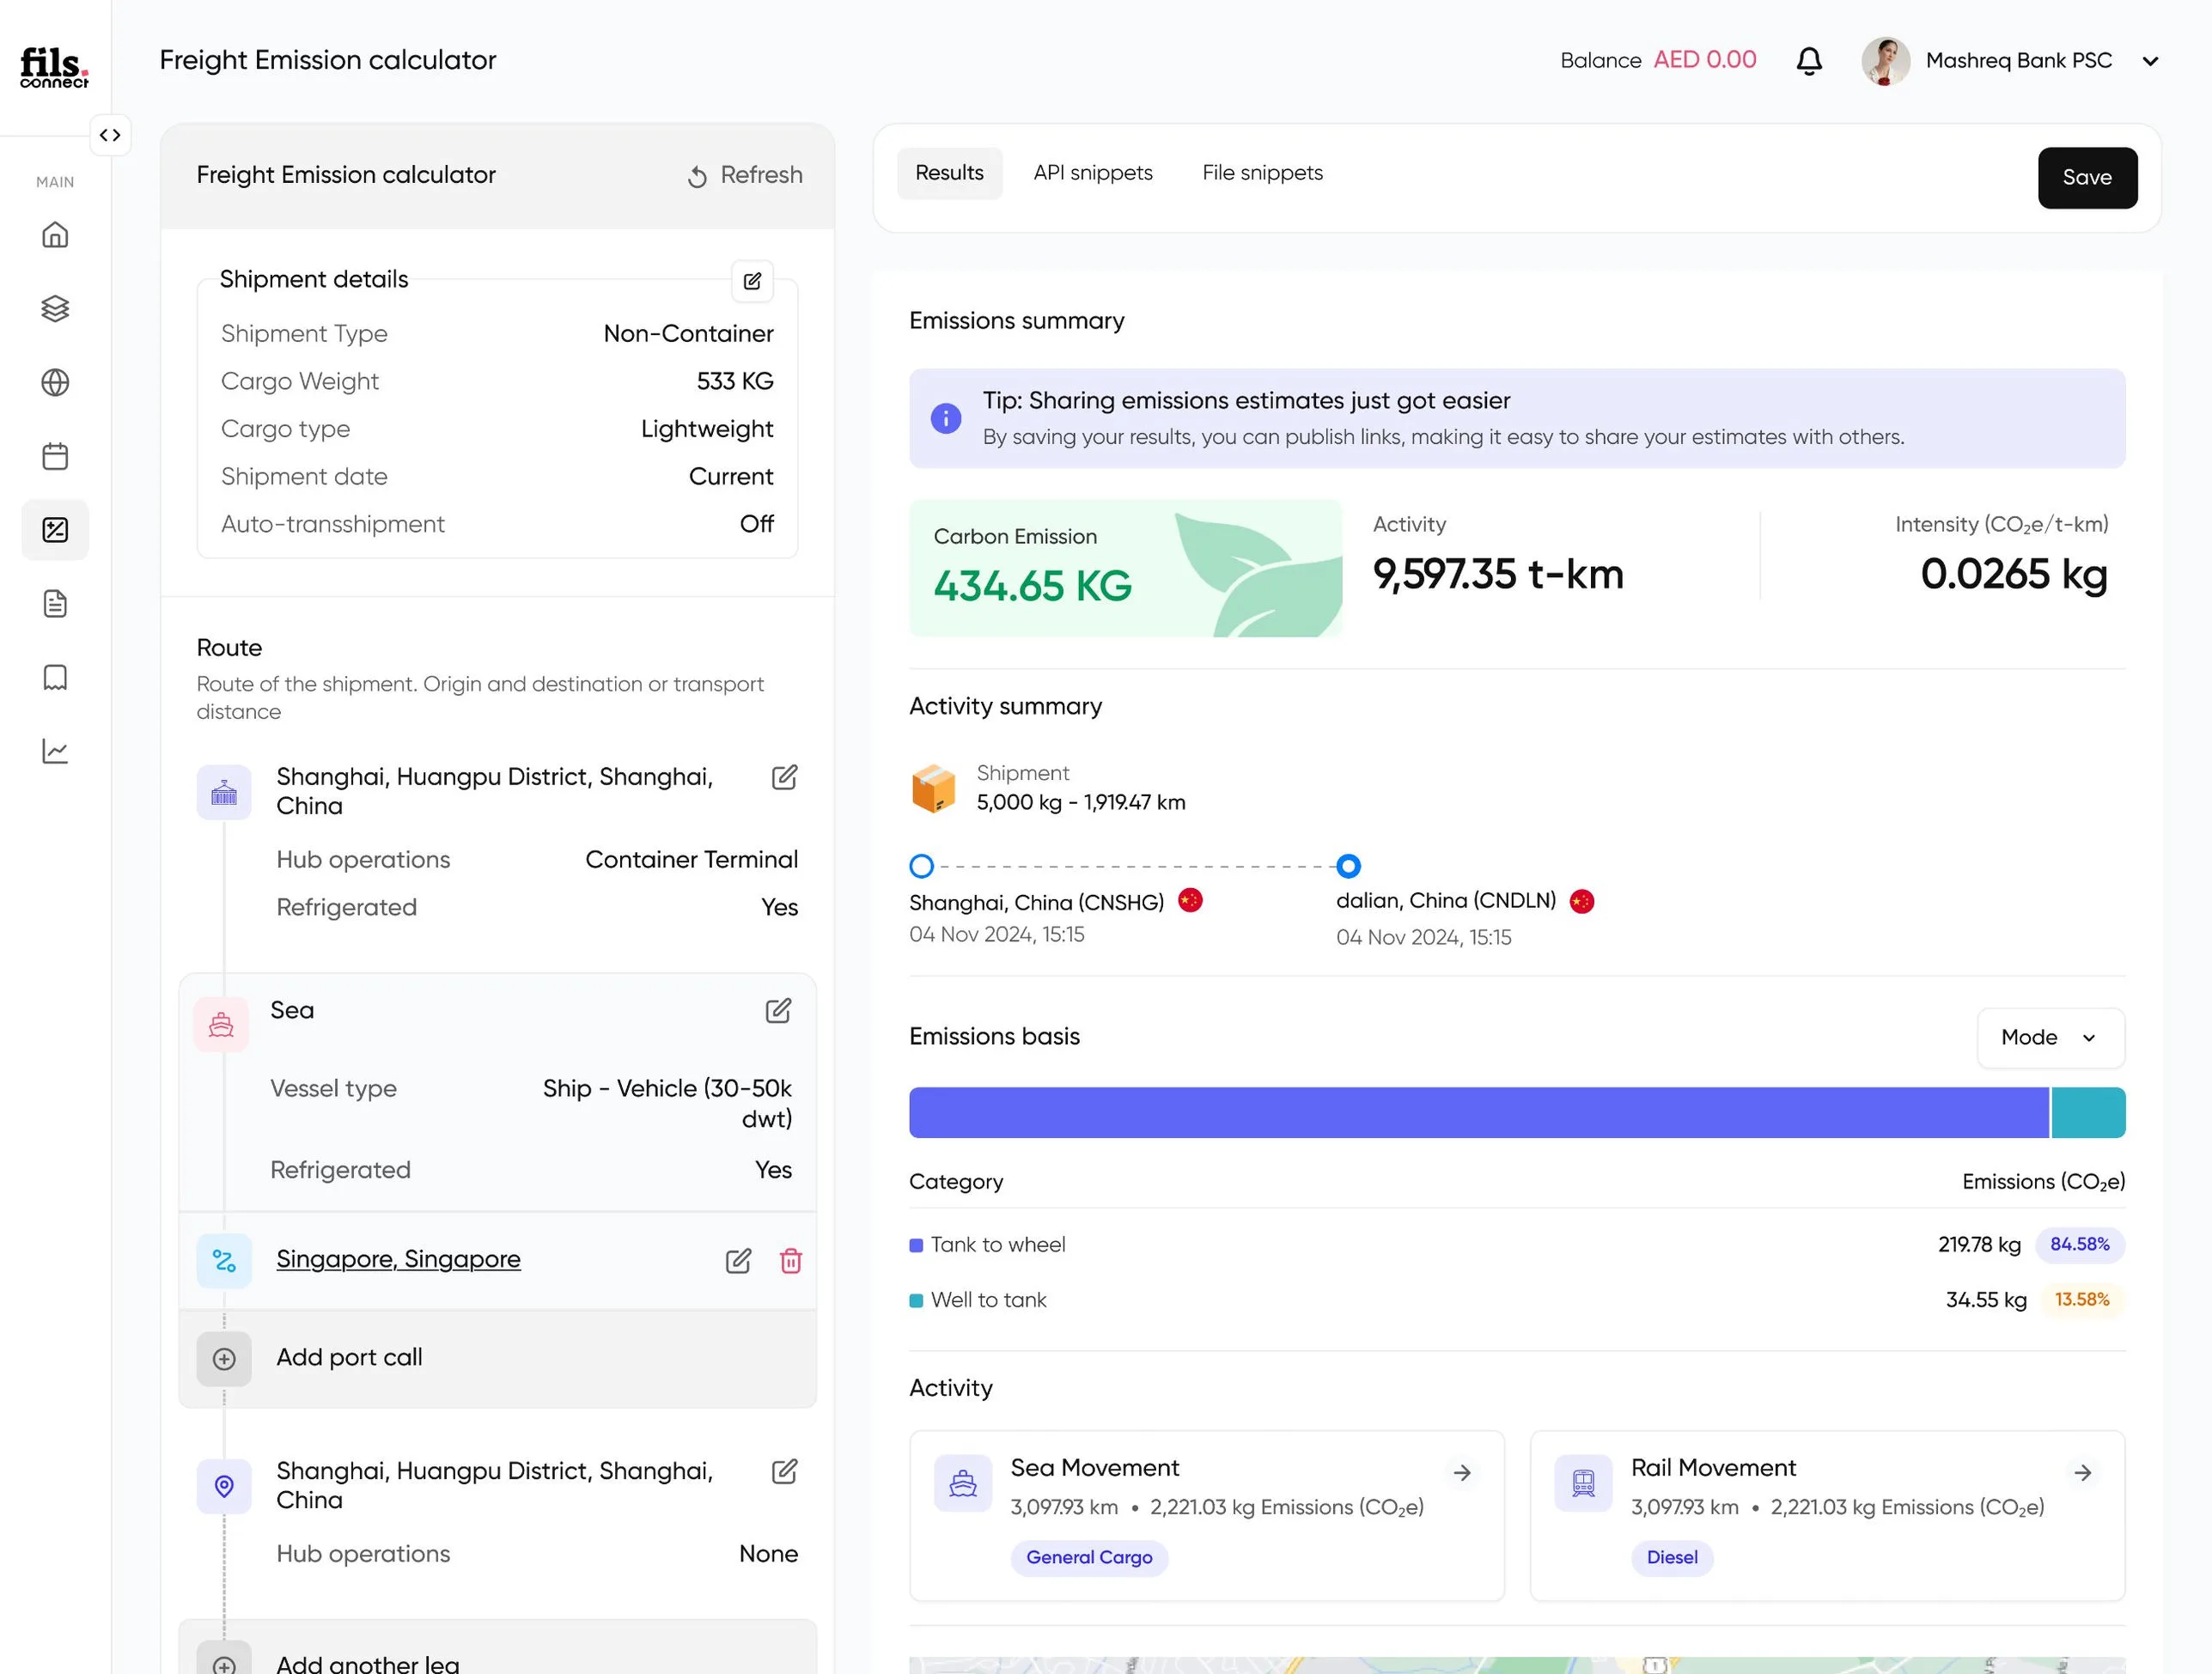
Fils accounts emissions at the row level, every shipment, every leg, every mode. The emissions ledger shows origin, destination, distance, weight, CO2e, t-km activity, intensity, data quality, and offset status, filterable, sortable, paginated. The freight calculator is where rows get created: multi-modal route building (sea, road, rail, air), with port-call legs, hub operations, and a tank-to-wheel + well-to-tank split for every result. Outputs save back to the ledger and to GLEC reports.
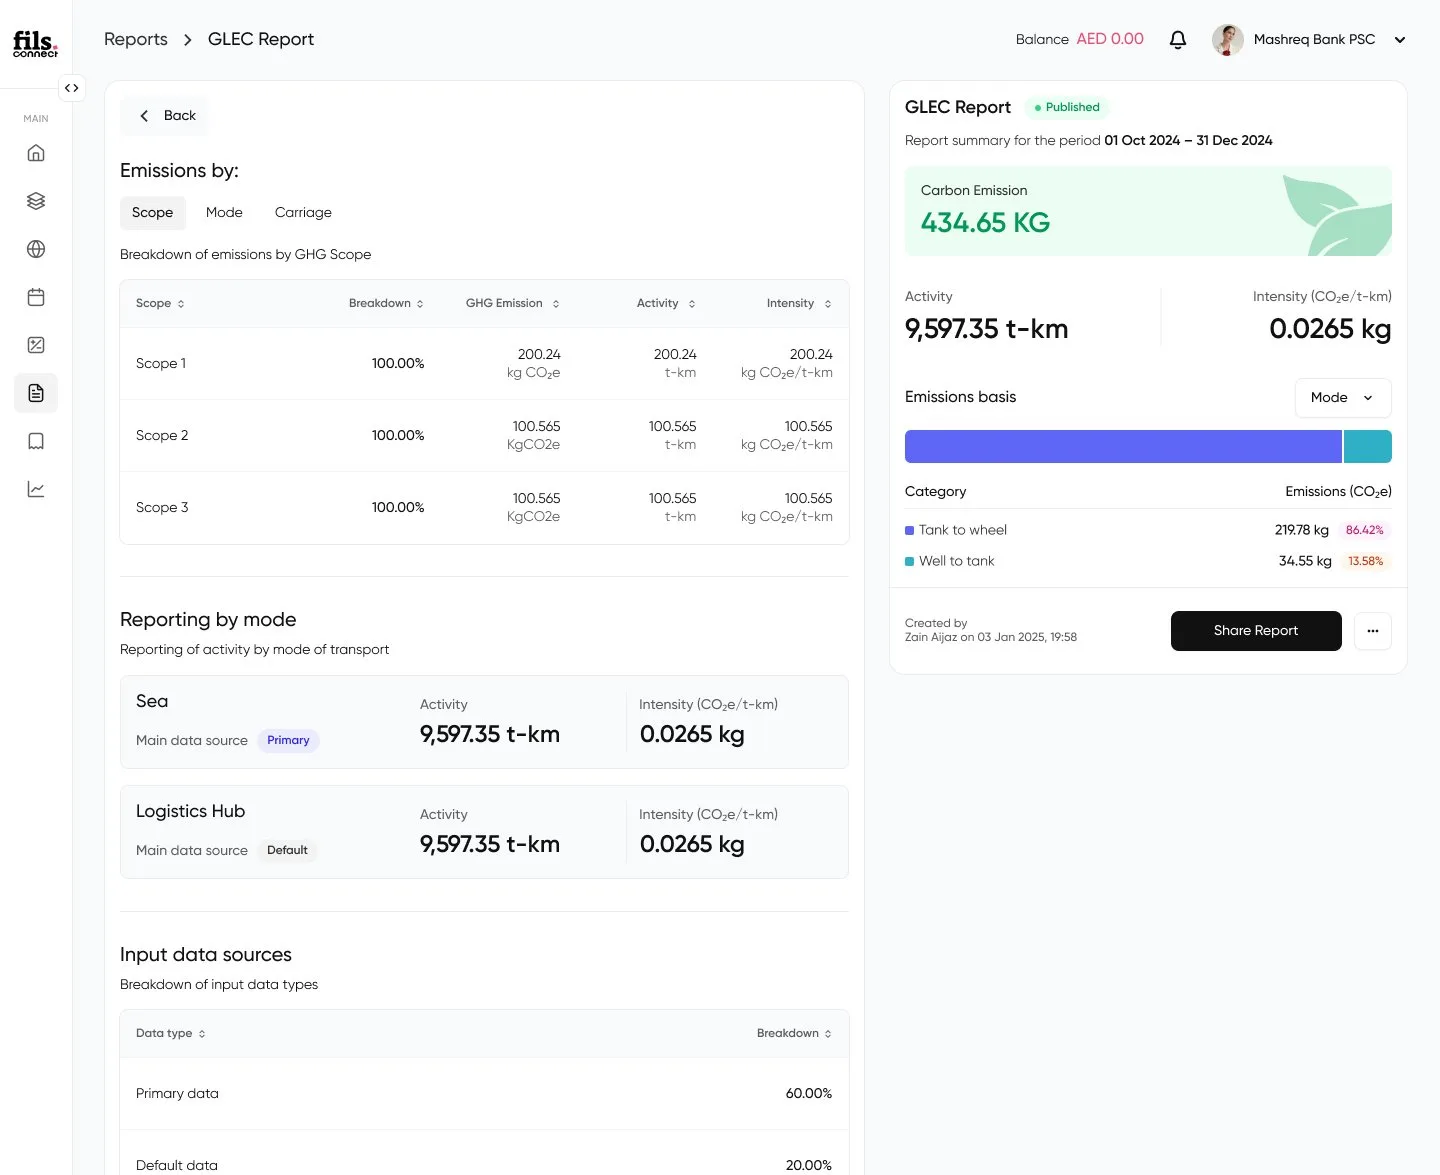
The GLEC report rolls up a tenant’s freight emissions over a chosen period in three stacked views: by GHG scope, by mode of transport, and by data source quality. Reports publish to a public URL shareable with regulators, auditors, or ESG-disclosure stakeholders. Headline numbers (emission, activity, intensity) sit in a right-rail summary, pre-formatted for embed.
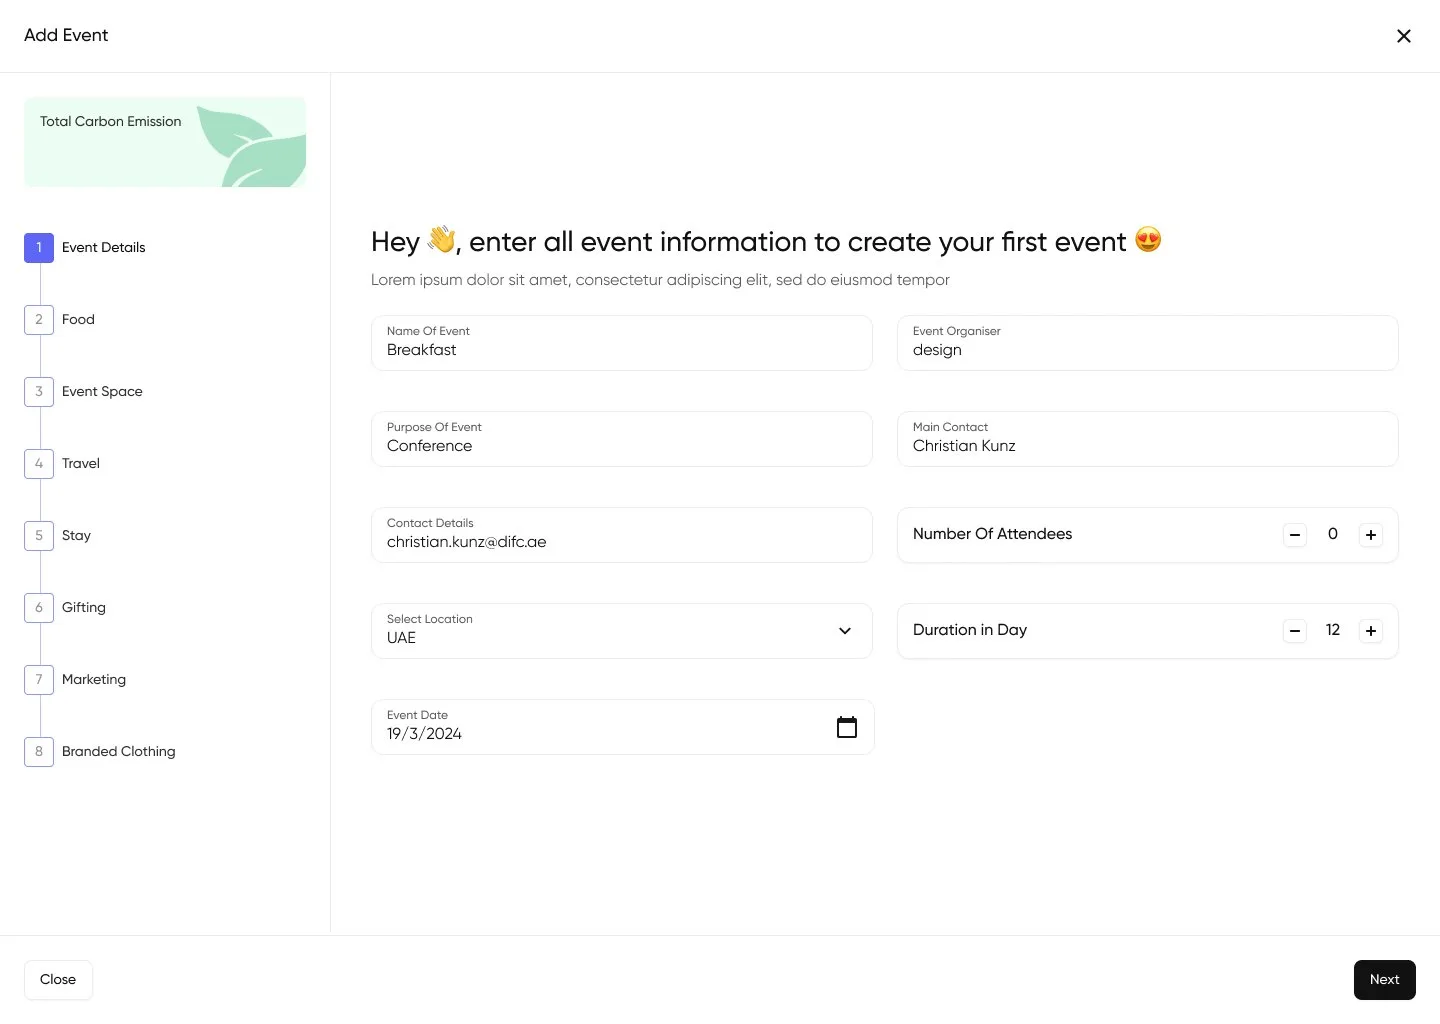
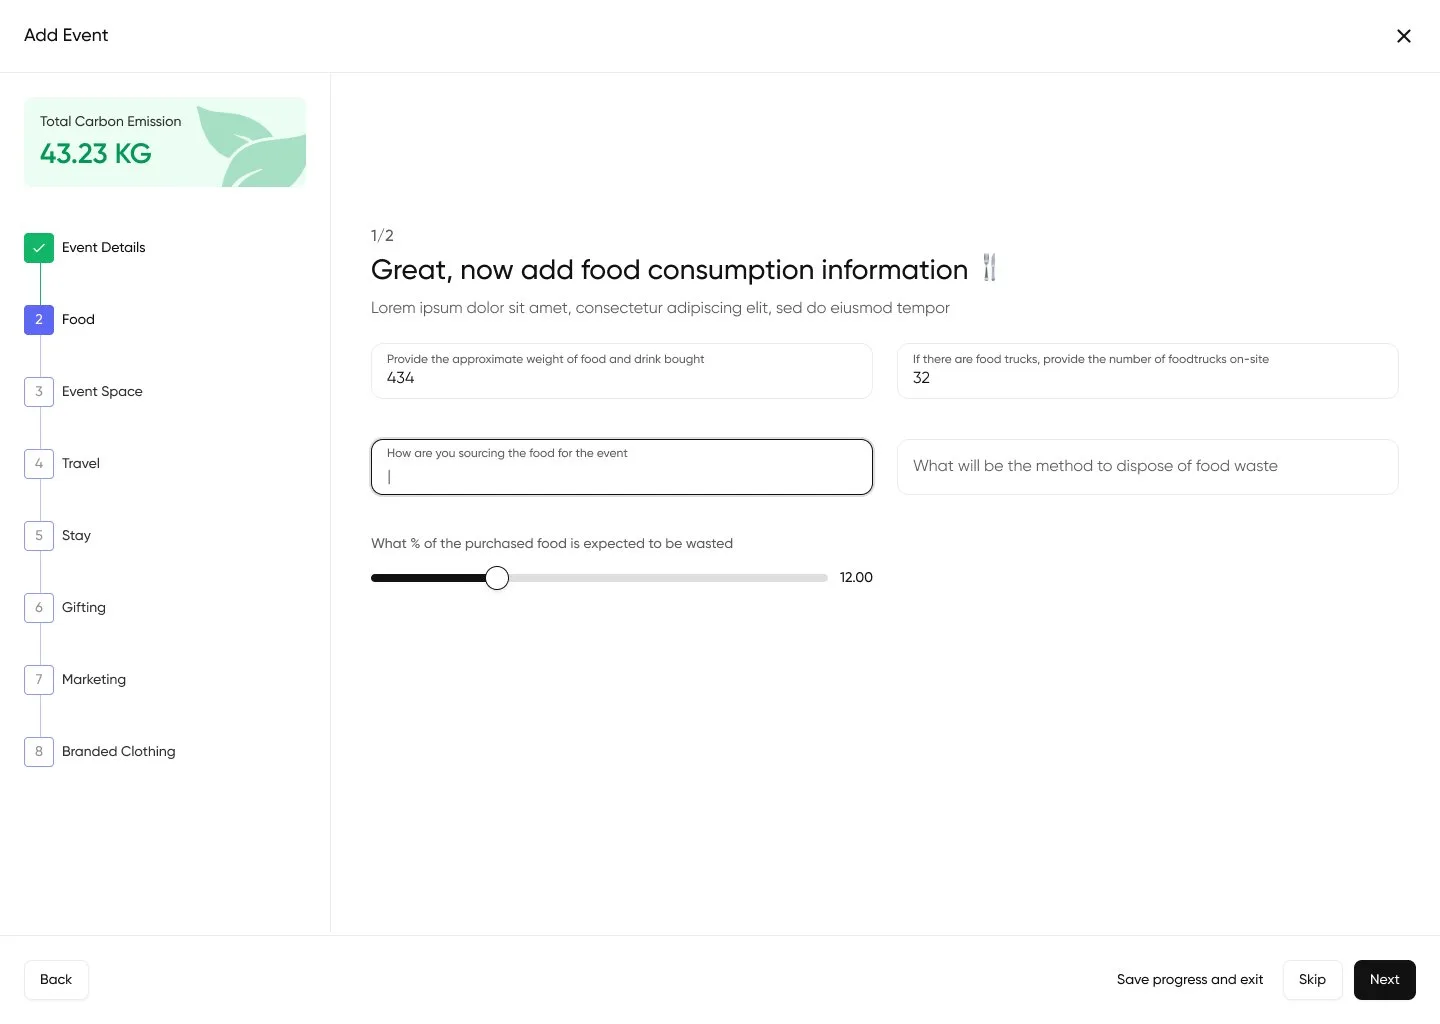
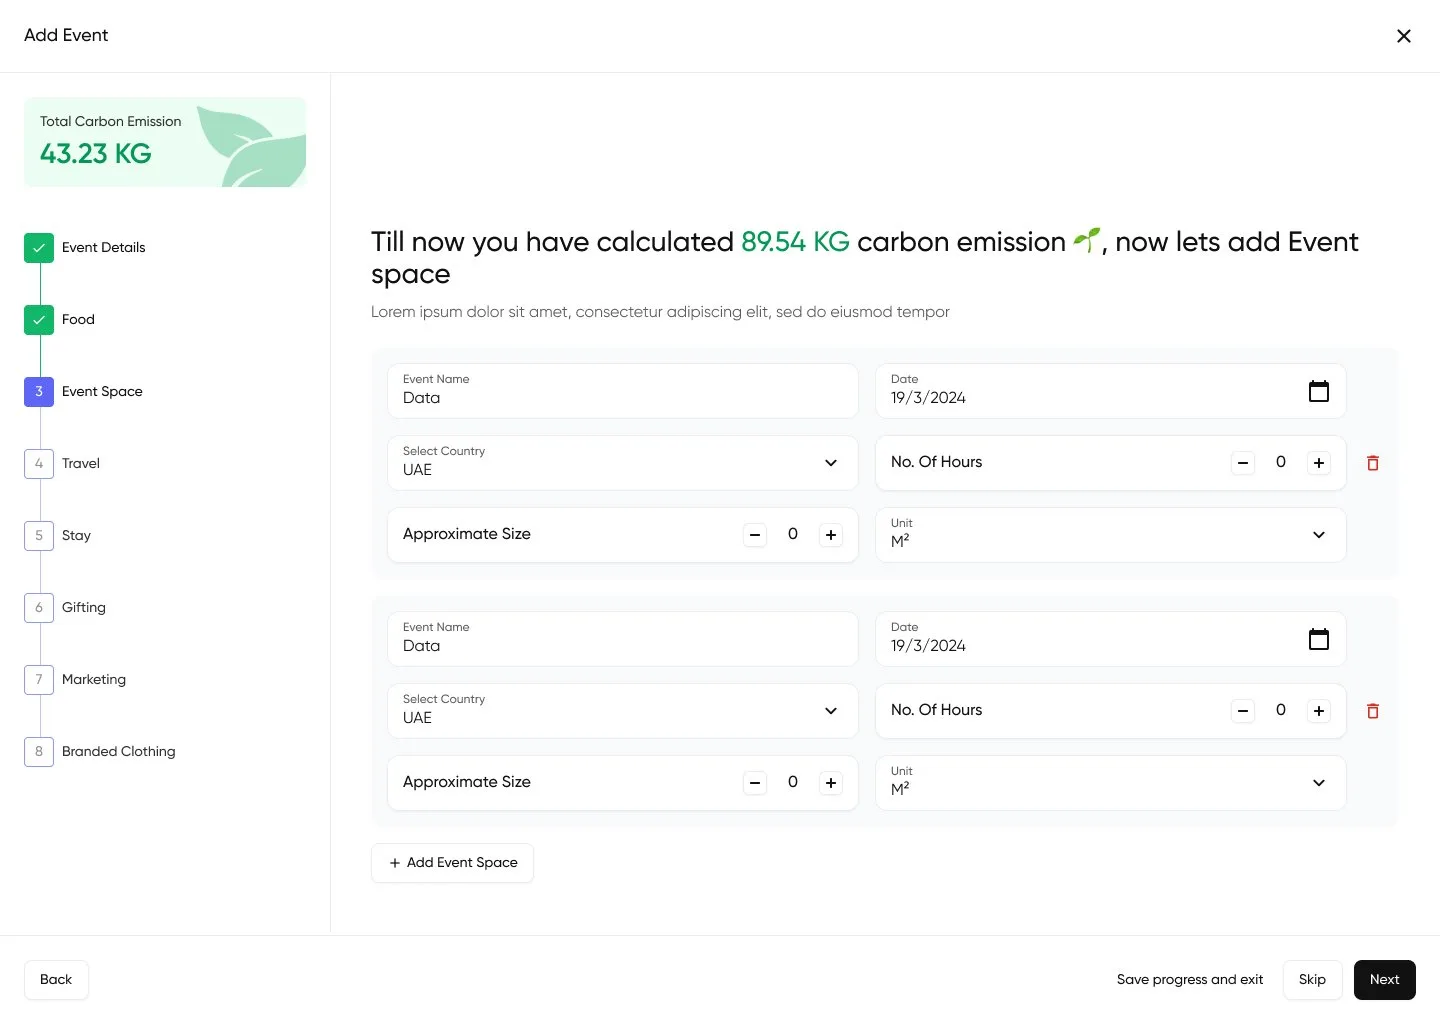
A standalone product inside Fils for measuring an event’s footprint, one of the harder UX problems we touched. Eight stages (Event Details, Food, Space, Travel, Stay, Gifting, Marketing, Branded Clothing), each contributing to a live “Total Carbon Emission” counter in the left rail. Forgiving by design: skip a step, save progress, come back later. Each step outputs its own per-step kg-CO2e contribution.
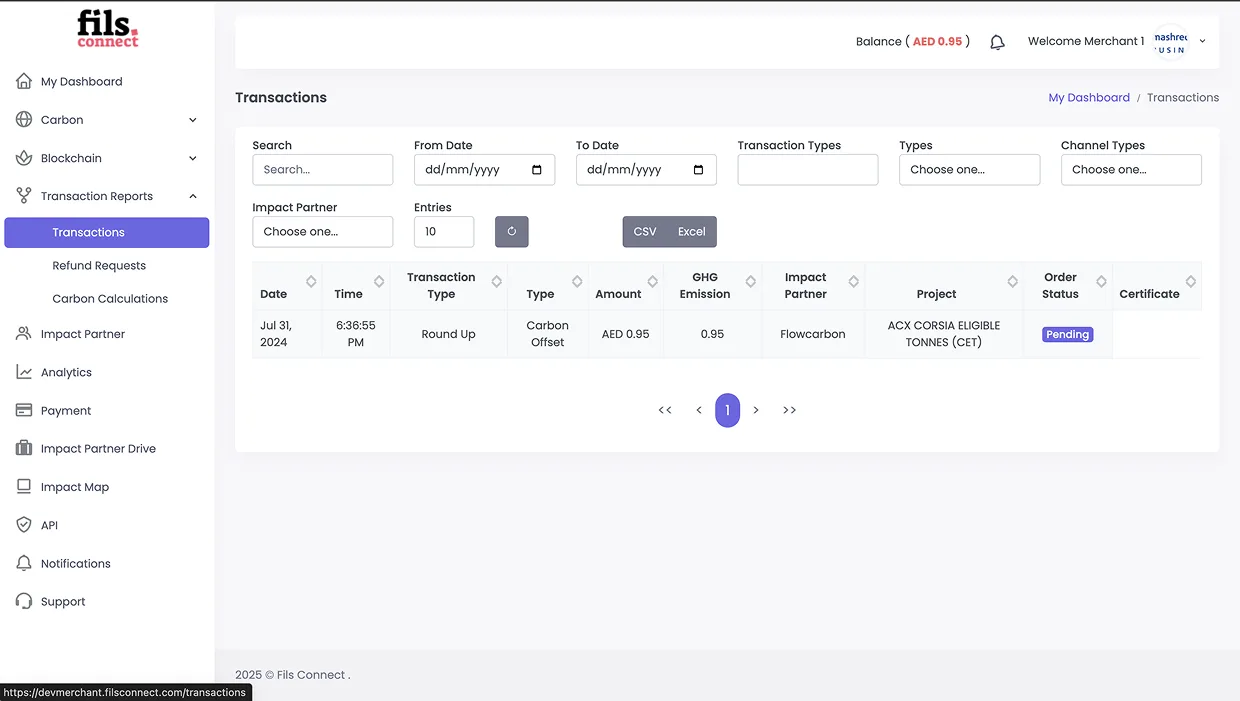
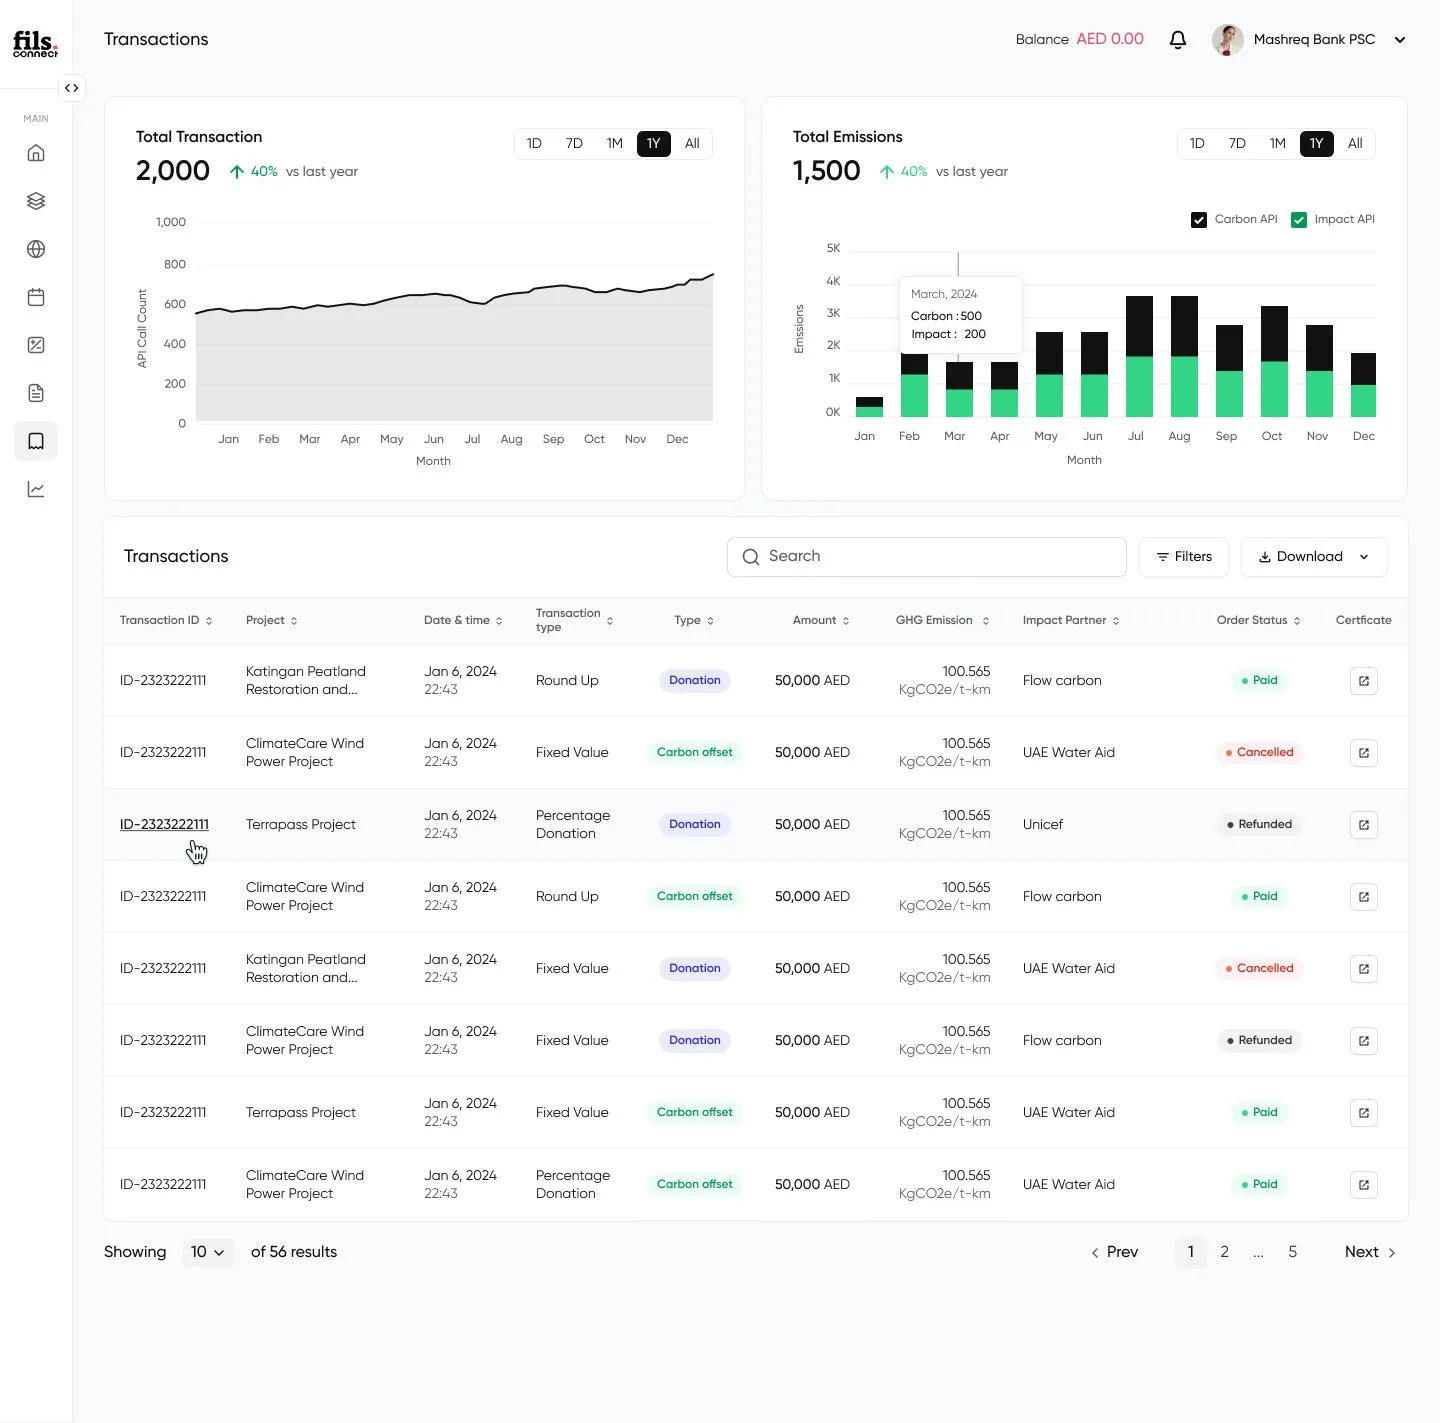
Every offset purchase, donation, round-up, and percentage donation flows into a single transactions surface. Status, amount, GHG offset volume in kg CO2e, impact partner, project, and certificate, with a 12-month emissions chart pegged against the transaction count chart on top. The auditor’s view, the CFO’s view, the sustainability lead’s view, all the same screen.
Seven products, one shared system, multi-tenant from day one, GLEC-aligned reporting, bank-grade public sharing, and an audit-ready ledger. Live with the anchor bank, ready for the next rollout.
Book a free sprintOne scoped surface, no ramp-up. The same way we started with Fils. If it doesn’t click, keep every file we ship.
Feedvisor came with an established product and a tired UX. We rebuilt the onboarding, dashboard, and design system, plus a marketing-asset library that ships alongside the product.