Fils
Climate fintech SaaS helping banks and enterprises measure, offset, and report carbon emissions.
Fils had product-market fit on the climate-tech narrative, the product worked. But the surface had been built by different hands at different times: single-tenant where it needed to be multi-tenant, tab-based where it needed to be a wizard, two-project where it needed to be a marketplace. This is what the platform looked like when the engagement began.
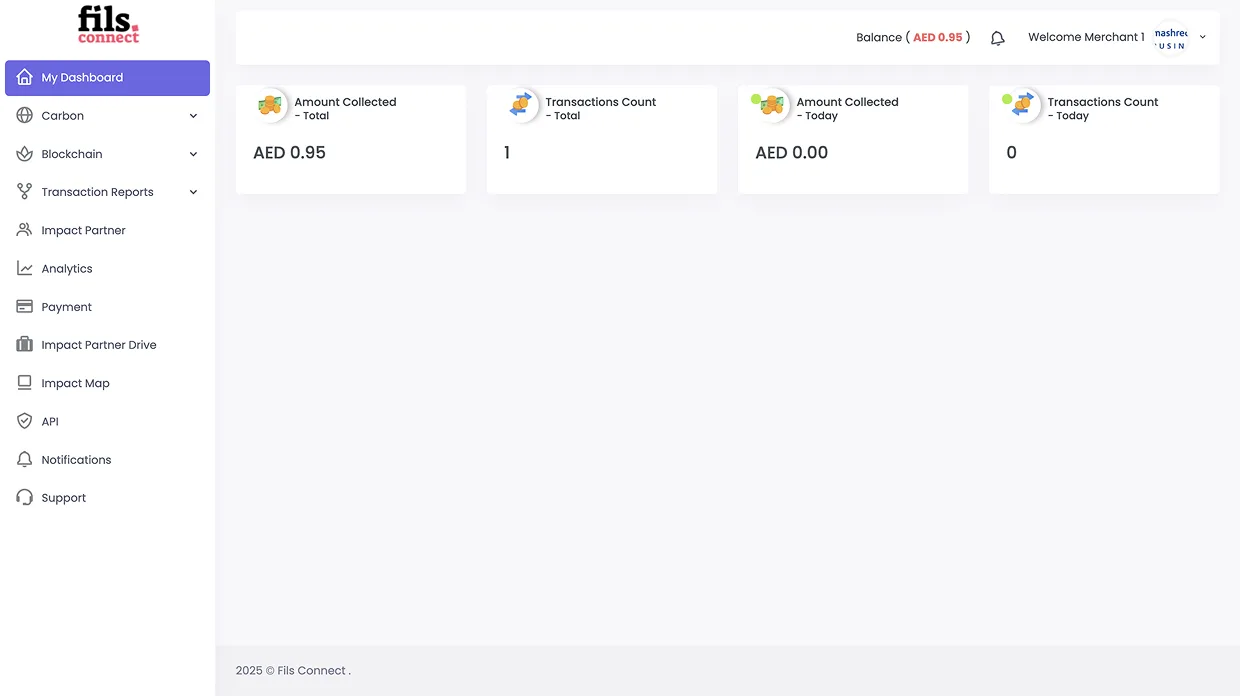
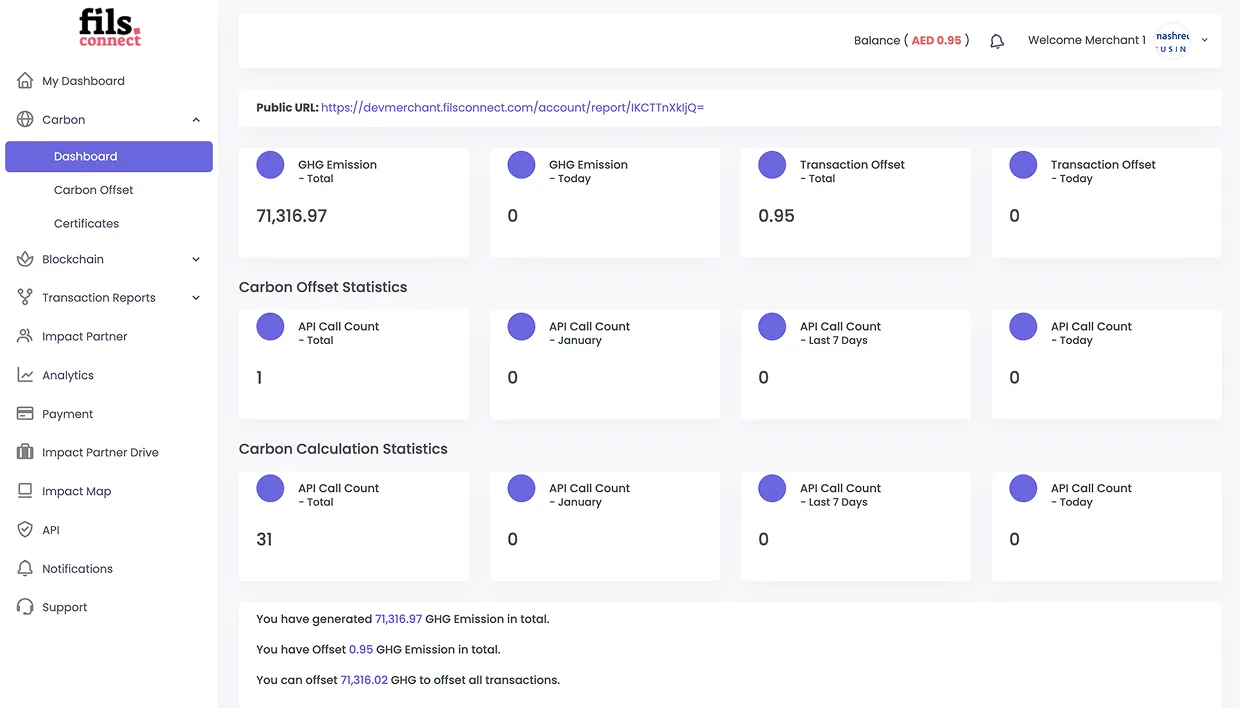
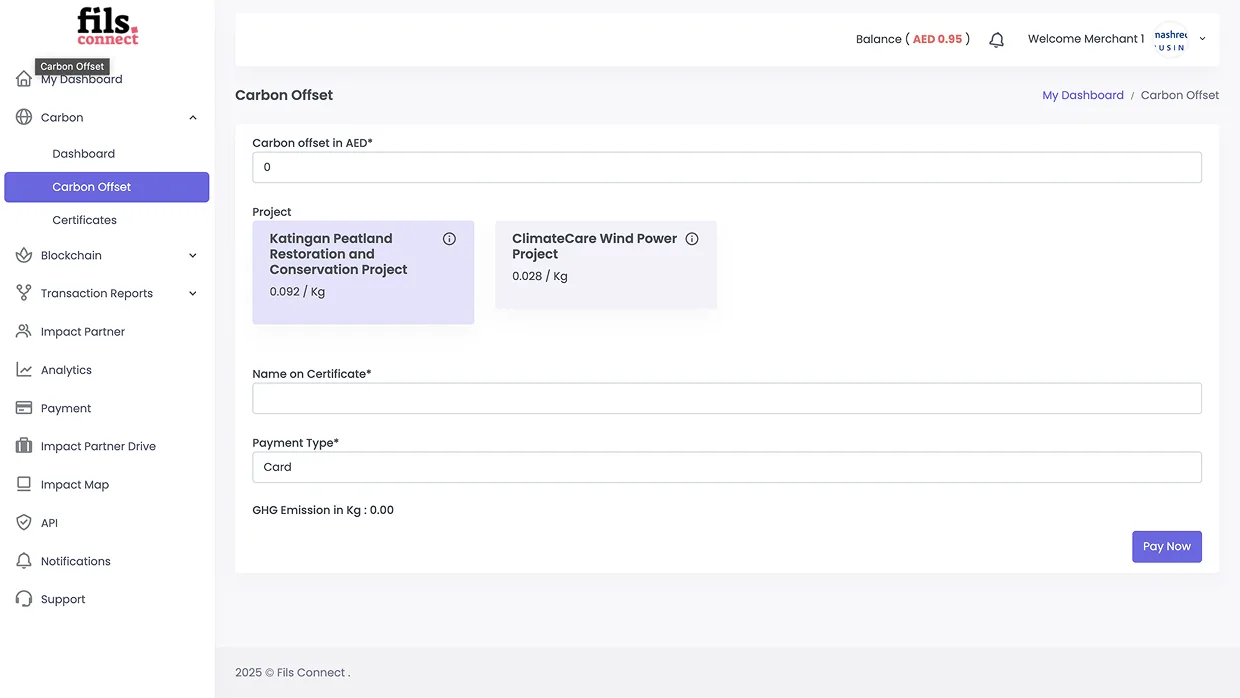
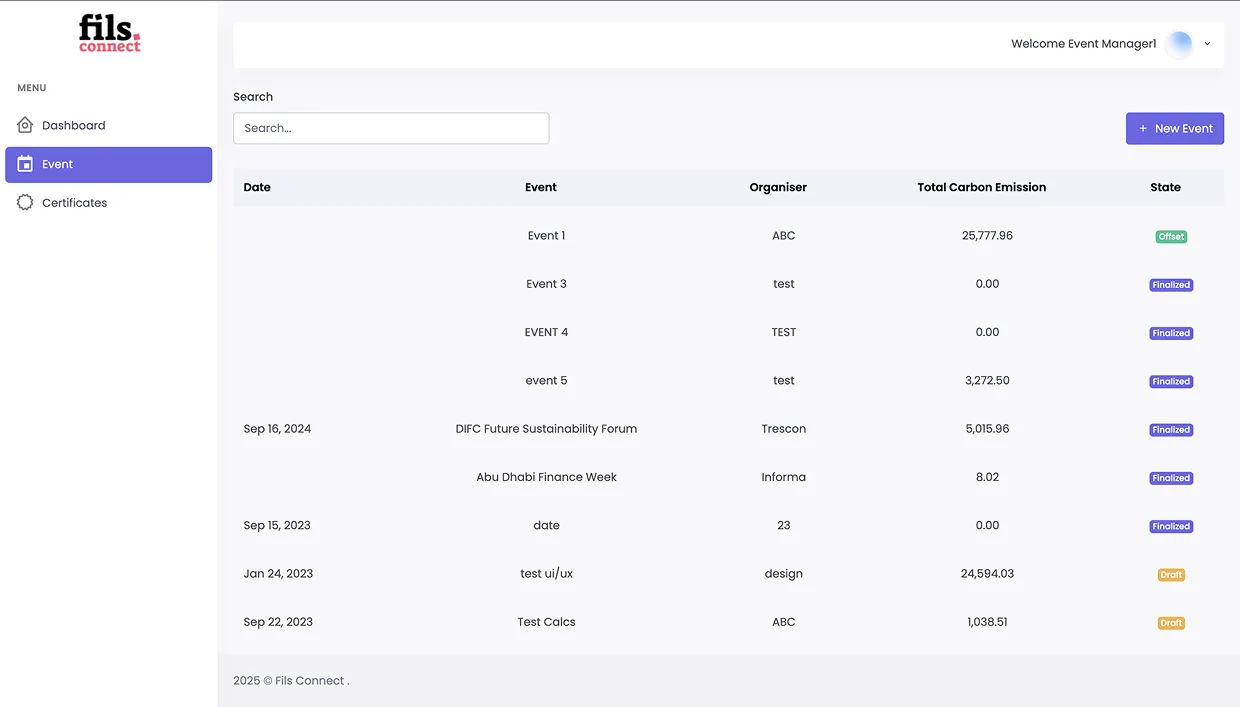
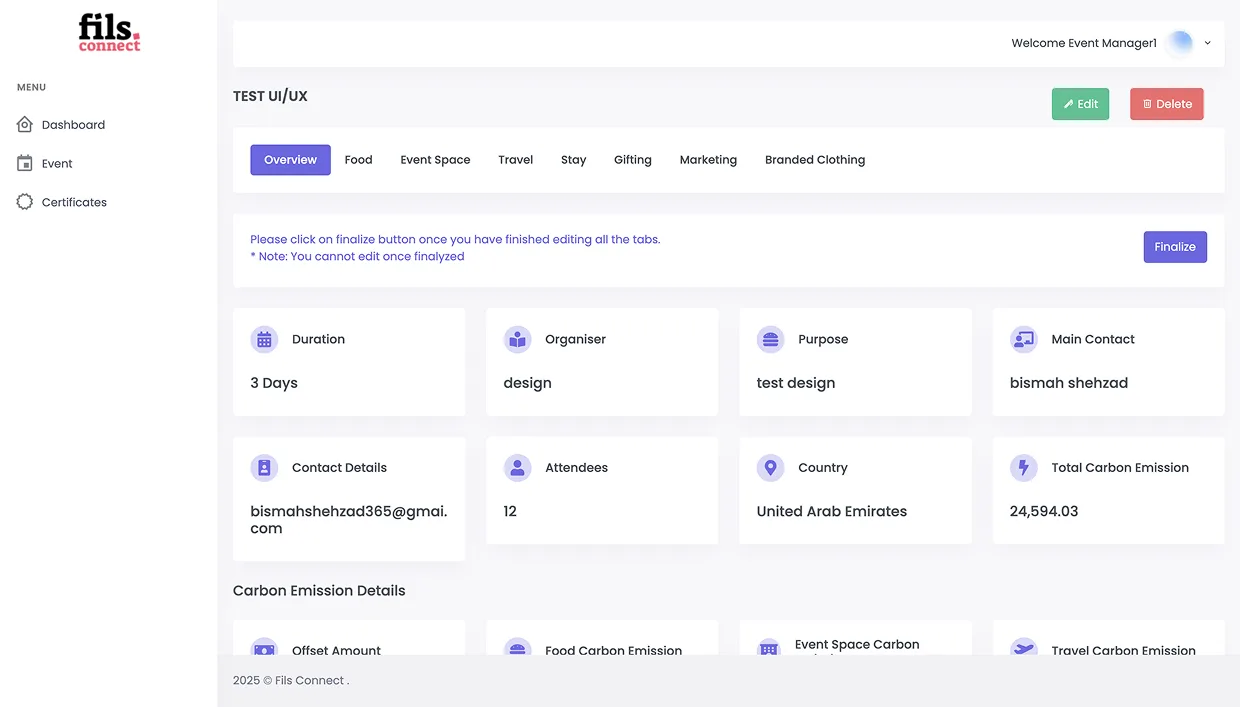
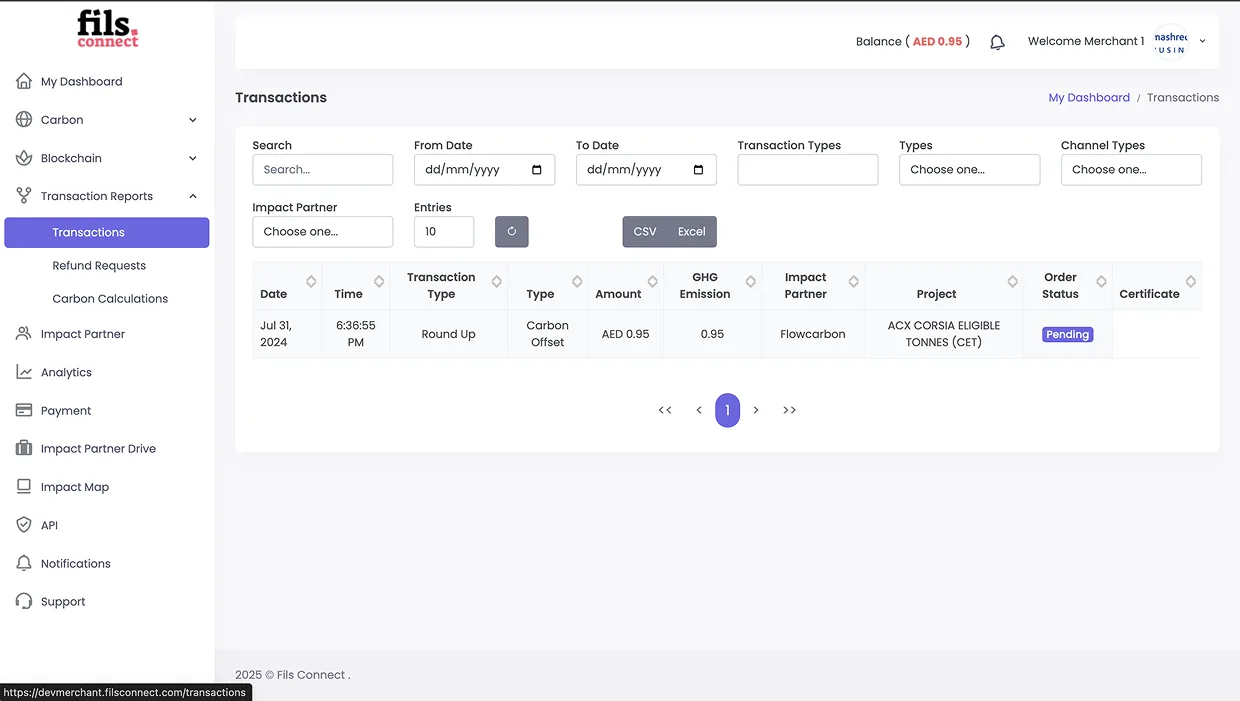
Fils helps banks and enterprises measure, offset, and report carbon emissions through one SaaS platform.
The product had strong climate infrastructure behind it, but the experience needed to match the expectations of enterprise buyers. Banks needed trust. Sustainability teams needed clarity. Operators needed structured data. Auditors needed reporting confidence. End users needed carbon offsetting to feel simple enough to complete.
Fils first gave Denovers a focused 7-day trial: redesign the dashboard and carbon offset flow. We turned the dashboard into a clearer command center for impact, activity, projects, and offset actions. We also redesigned the offset flow from a basic form into a guided journey where users could select a verified project, choose an offset amount, see the impact update, and complete the transaction.
That trial gave Fils confidence to move into a platform-wide UX/UI sprint. Across the engagement, we redesigned the core Fils platform across connected modules and workflows, supported by a reusable multi-tenant design system.
The dashboard became the central command center for the platform. Instead of only showing disconnected numbers, we designed a surface that helped users understand total impact, emissions activity, offset progress, project performance, and the next action to take.
Impact widgets, carbon graphs, offset CTAs, project activity, and tenant-level performance all came together in one view. The goal was simple: open the product and immediately understand what has been emitted, what has been offset, and where action is needed next.
Offsetting could not feel like a dry transaction form. We redesigned the offset journey so users could browse verified projects, understand project impact, choose how much carbon to offset, and complete payment through a clear checkout experience.
The flow made climate action feel more tangible and helped connect every offset back to projects, transactions, certificates, and reporting.
For enterprise climate accounting, high-level dashboards are not enough. Fils needed shipment-level and activity-level visibility across origin, destination, distance, weight, CO2e, emission intensity, data quality, mode, offset status, and transaction status.
We designed the emissions ledger as the operational backbone of the platform: structured, filterable, and built for teams that need to manage carbon data every day.
Freight emissions are complex because one shipment can move across sea, road, rail, air, ports, hubs, and multiple route legs. We designed the freight calculator as a guided workflow where users could build shipment routes, define transport modes, enter cargo details, and calculate emissions across different legs.
The output was not just a number. It became a structured record that could feed into the emissions ledger and reporting system.
Reporting had to feel credible, structured, and easy to share. We designed reporting views around emissions by scope, transport mode, data source, activity, intensity, and total footprint.
A summary panel kept the most important numbers visible, while deeper sections allowed sustainability teams and stakeholders to review the details behind the report. The experience was designed for enterprise clarity, not just visual polish.
Event emissions are messy: food, venue, travel, stay, gifting, marketing material, branded clothing, and more. Instead of one long form, we designed an 8-step wizard that helped users calculate event emissions category by category.
A live emission counter made the impact visible as users moved through each step, making a complex sustainability workflow feel manageable.
The biggest risk was designing each module as a separate experience. To avoid that, we built a shared design system for dashboard cards, tables, filters, charts, forms, steppers, marketplace cards, impact widgets, reports, transactions, and tenant branding.
This gave Fils a scalable foundation for bank-specific rollouts without redesigning the platform every time.
Fils moved from a promising climate-tech product to an enterprise-ready carbon SaaS platform. The final outcome included 100+ screens across dashboard, carbon marketplace, offset purchase flow, emissions ledger, freight calculator, GLEC/GHG-aligned reporting, event carbon wizard, transactions, and multi-tenant design foundations. The product became clearer for sustainability teams, more credible for banks, and more scalable for future enterprise rollouts.
Fils did not just get redesigned screens. They got a scalable product foundation for enterprise climate action, built around clarity, trust, and repeatable tenant rollout.
Building a complex fintech, climate-tech, or enterprise SaaS product? Start with one critical flow. We’ll audit it, redesign it, and show how your product can become clearer, more credible, and easier to scale.